Ferny Grove Weather instrumentation changes evaluation
Published on 24 November 2019 based on data as of 17 November 2019
Introduction
This evaluation compares the data recorded by a Davis Instruments Vantage Pro2 Automatic Weather Station (AWS) that replaced the existing equipment on October 4 2018. The comparison was made through to 31 October 2019 at an unofficial suburban observing site at Ferny Grove in north-west Brisbane, Australia. The previously installed equipment was reaching the end of its life and to maintain continuity of the collected data a comparison noting the differences between the systems was deemed to be important to document how this would affect the site record. Ideally when a meteorological site is relocated or major changes are made to instrumentation that an evaluation of at least 10 per cent of the record period is undertaken before the old equipment is decommissioned from use. For the weather parameters that the new equipment will now measure, a period of 13 months was used for the evaluation which was dependent on the continued performance of the old equipment being well past its design lifetime.
Davis Instruments AWS are renowned for manufacturing quality and accurate high end systems aimed towards many types’ of weather focus people such as weather observers, farmers and researchers. The equipment being replaced was much lower grade, less reliable and of low accuracy. Naturally there are differences between the data output of the two systems, in addition to improved siting of the new equipment which makes measurements more representative of the weather but not directly comparable with the previous recorded observations.
Contents
Links for major section of this page
The comparison
The comparison was conducted at a suburban site, located in a medium-density housing area on the western fringe of the city of Brisbane. Suburban housing surrounds the site with open space to the south and south east of the site of site (400 to 800 metres away) and Ferny Grove railway station and Samford road about 500m to the east southeast. Ferny Grove (population 5609 – 2011 census, 5725 – 2016 census) is a hilly suburb with the site in the northern part of the suburb. The site is surrounded by the very hilly Brisbane Forest Park (on the southern extend of the D'Aguilar Range) to the west (on the fringe of Ferny Grove) and to the north (Ferny Hills). Hilly forests also extend to the south of the suburb (Keperra). Underlying soil is a mixture of heavy clay and shale rock of reasonable drainage. Storm water drainage is good, closest waterway is the Kedron Brook 400 metres to the east.
The Davis Vantage Pro 2 (VP2) is a professional mid-range equipment of moderate accuracy. This collects data every 2.5 seconds for wind speed and direction and every 10 to 15 seconds for most other parameters. The sensors measuring temperature, humidity and rainfall (the Integrated Sensor Suite) transmit this by a very reliable wireless signal to the indoor receiving console using a solar powered transmitter. Similarly a separate solar powered transmitter sends the data from the separately installed wind speed and direction sensor to the indoor receiving console. The sensors are sited in the most suitable locations that are available in the suburban backyard.
The VP2 is sited in more exposed locations than the old equipment which was meteorologically less representative of the observing site. The previous equipment was the La Crosse WS 2306 which records Temperature, Humidity, Rainfall, Barometric Pressure and Wind Speed and Direction. It records from three outdoor sensors at 128 second intervals and transmits via wireless signal to a base unit indoors. The rain and wind sensors are cabled to the Temperature Humidity Sensor.
The data from the old equipment was collected by a data logger read by software and logged the data at 5 minute intervals. Daily averages, totals and extremes were computed from this input and also manually recorded from the base unit which was stored and collated electronically. Many of the meteorological parameters were measured midnight to midnight local time, though standard rainfall totals and temperatures were measured 9 am to 9am (rainfall and minimum temperature as 24 hours to 9am and maximum temperature as 24 hours from 9am).
The VP2 was configured to log at 5 minute intervals and data collated similarly to the old equipment. In March 2019 the logging software was used full time with little negative impact on the recorded data. Under each section of this comparison by meteorological parameter is further information of the siting of the sensors. On April 1 2019 the electrical connector of the La Crosse station data logger failed, ceasing the 5 minute logging comparison that began on 4 October 2018. The comparison continued after this date using the daily extremes and averages only. The comparison continued through to 31 October 2019 provided that old equipment could remain in operational condition, completing the 13 month comparison.
Temperature
Owning to the siting limitation of the old equipment various sensors have been in use. For the preceding 6 years (from September 2012) minimum temperature was measured by a manual liquid in glass minimum and maximum thermometer of moderate accuracy. Maximum temperatures were collected from the sensor output of a La Crosse WS1600 IT weather station measured by a electronic temperature sensor (TX22IT) from February 2010 replaced by a La Crosse WS2306 station (sensor: WS2300-25S) from February 2017 which was in use since September 2011. Note that these siting are non-standard within a non-standard environment so that are not meteorologically representative of the local area. Standard siting involves temperature instruments installed in a white painted timber double-lourved shelter (Stevenson Screen) which provides protection from solar and long-wave radiation and permits the movement of air. In contrast the maximum temperature sensor was attached to the brick veneer of the site dwelling while the minimum temperature sensors was mounted in such a way that was minimally sheltered from the elements over grass. Therefore the data recorded was charactered by a small negative bias for the minimum temperature. Maximum temperatures were unduly affected from radiated heat on hot days and being sited in a restricted location the responsiveness of the sensor to large changes in the temperature was affected.
The VP2 by contrast is sited in a more exposed location and more in compliance with standard siting practices. The temperature sensor is a Sensirion SHT31 combined temperature and humidity sensor (PN Junction Silicon Diode) with a nominal accuracy of +/- 0.3 ºC. This is installed within a non-standard shelter (radiation shield) that consists of plastic plates that allow the flow of air between the plates but protects the sensor from the elements at 1.4 m above ground level over grass. However it should be noted that this is not mounted in accordance with the official standards but records data more representative of this site compared to the old equipment. From November 2018 a small solar powered fan was added to the shield to assist with movement of air during days of high temperatures and light winds. Stevenson screens can also over-read in sunshine with little airflow. The responsiveness of the VP2 temperature is likely to be greater than instruments installed in a Stevenson Screen and to a greater degree compared to the old sensors. Some differences between the old equipment and the VP2 can be attributed to this responsiveness resulting in a slight over-reading of the highest temperatures.
For the comparisons between the old equipment and the VP2 daily data was logged by calendar day (midnight to midnight) for maximum temperatures and 9am to 9am for minimum temperatures. The comparisons reference the VP2 from the old equipment. Also data logged every 5 minutes was also compared to analyse over a higher number of data points and by time of the day (and for other parameters also). A positive difference means that the VP2 data was higher than the old equipment. No calibrations have been applied to the temperature data of all these sensors.
Table 1 outlines the means and extremes during the 13 month comparison period by month, and Table 2 outlines the frequency of the daily differences between the two systems.
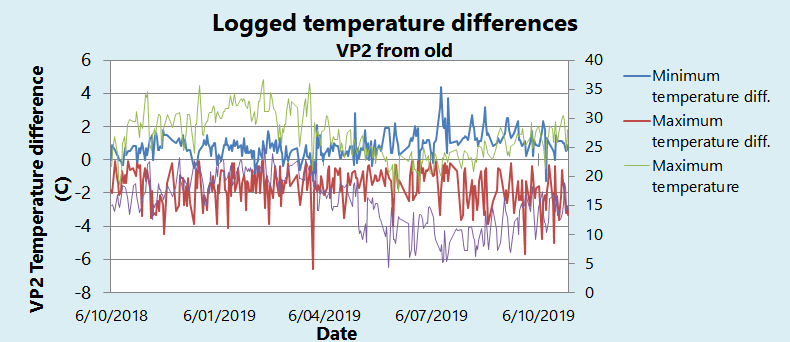
Figure 1 – Logged daily minimum and maximum temperatures by the VP2 and the difference of the VP2 from the old equipment for the comparison period. Differences in maximum temperature can be clearly been seen while minimum temperatures show a more consistent difference.
The comparisons showed when analysed by mean temperature the difference measured by the VP2 was 0.02 ºC lower than the old equipment. Note that this difference doesn’t account for the calibration of the lower accuracy old equipment. The monthly mean temperature differences are much higher during the winter of 2019 and into early spring 2019 attributed to the VP2 measuring higher differences between the two sensors for overnight temperatures compared to the preceding summer. In spring 2018 through to autumn 2019 monthly mean temperatures between the systems were in very good agreement where the VP2 difference was between +0.2 ºC and +0.4 ºC compared to the old equipment.
Comparisons between daily minimum and maximum temperature show differences in the logged temperature data between the two systems (Figure 1). Logged minimum temperatures by the VP2 were higher and maximum temperatures were generally lower. Some days of the minimum temperatures logged by VP2 were less than the old equipment. During the winter minimum temperatures recorded by the VP2 were equal or higher than the old equipment compared to the rest of the comparison period. There was greater variability to the daily maximum temperatures throughout the comparison period where the VP2 saw some days that were significantly higher or lower compared to the old equipment and some of these that were higher than the old equipment were during hot days, while some that were lower were during cool days.
The overnight temperatures as logged from the La Crosse sensor sited on the site dwelling recorded much higher temperatures than the VP2 and the liquid in glass thermometer due to the siting. It for that reason the liquid in glass thermometer was used to obtain the once daily minimum temperatures to compare against the VP2 which were sited side-by side.
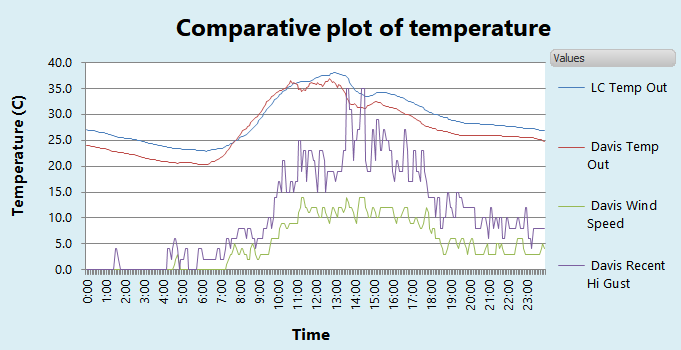
Figure 2 – temperature and wind plot for 13 March 2019 showing the greater responsiveness of the VP2 (marked as Davis Temp Out) to changing conditions and the lag in the old equipment (marked as LC Temp Out). Whilst not occurring on the majority of days, a day such as this resulted in a lower maximum temperature on the VP2. The difference in the logged overnight temperature can also be seen.
On warm and sunny days the temperature rise of the VP2 is noticeably quicker due to the more open exposure of the VP2 before the old sensor would often catch up to reduce some of this difference depending on the cloud coverage, wind speed and whether there was ample time for the old sensor to response to the changing conditions (Figure 2). Conversely especially on cooler days and or changeable cloud cover the temperature logged by the VP2 varied during the day with lower temperatures often recorded compared with the old sensor.
Mean minimum temperatures as logged by the VP2 was higher than the adjacent liquid in glass thermometer where 8.1% of nights showed a negative difference (32 out of 393 nights). The 13 month mean minimum temperature was 0.86 ºC higher with a temperature of 15.5 ºC. For each month this difference was between +0.7 ºC and +1.5 ºC except for October 2018 (+0.4 ºC), March (+0.2 ºC) and April (+0.5 ºC). The highest daily difference was +4.4 ºC and the lowest was -1.3 ºC. During the 345 nights 23.9% were within 0.5 ºC and 83.5% were within 1.5 ºC of the liquid in glass thermometer. The liquid in glass is of unknown accuracy and this level of agreement is deemed to be acceptable. The coldest night was on 31 May 2019 where the VP2 observed a minimum of 4.4 ºC and the liquid in glass thermometer was 2.5 ºC.
The difference of the mean daily maximum temperatures ranged between -1.5 ºC in January and October 2019 and +0.1 ºC in July 2019. The 12 month mean maximum temperature difference was -0.91 ºC with a temperature of 27.7 ºC. The highest daily difference was +9.7 ºC and the lowest was -6.6 ºC. During 393 days the daily difference of maximum temperatures was within 1 ºC on 35.9% of days and within 2 ºC on 69.5% of days. Accounting for the low accuracy (estimated to be about +/- 2 ºC) and the site of the old equipment this is an excellent result. 75.1 % of days expressed a negative difference compared to the old sensor. The hottest day was 41.1 ºC observed by the VP2 on 12 March 2019 and the old sensor measured 38 ºC.
Looking at the correlation of the temperature data between October 2018 and March 2019 between the La Crosse and the VP2 showed temperatures were equally above and below the linear trend across all the logged data across most of the temperature range. The highest and lowest logged data at the extremes was generally lower compared to the old equipment. (Figure 3)
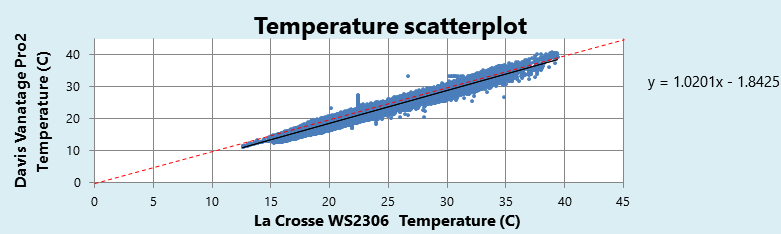
Figure 3 – 5 minute logged temperature data of Davis VP2 vs. the La Crosse sensor between 4 October 2018 and 31 March 2019 with 51, 286 matching data pairs. The solid black line is the linear trend which closely matches the perfect trend line (in red) where the dots above the trend line show the VP2 higher than the La Crosse and points below the trend line show the VP2 lower than the La Crosse.
Logged temperature data of the difference of the VP2 from the La Crosse by month for the 6 months between October 2018 and March 2019 (Table 3) showed that the hourly average temperature overnight (5pm to 5am) was 1.5 to 2 ºC lower and slightly less pronounced in January to March 2019. During the day temperatures were similarly lower but varied from month to month depending on cloud coverage and observed temperatures. On average the temperature difference during the morning was quite low and increased during the day and well into the afternoon. The tendency for lag in the fall of the temperature in the afternoon logged by the La Crosse sensor resulted in an average of 1 ºC difference through the afternoon.
When the temperature data is sliced during the same 6 month period by hour the logged hourly 10 minute average wind speed does affect the logged data (Table 4). The greatest negative difference of the VP2 data in the overnight hours is when the lightest winds occur as would be expected due to the fact that the coolest nights are a result of long-wave radiation of heat on still clear nights. During the day results are more mixed where the difference during the morning is generally not affected to a great degree. While there were exceptions and excluding the highest speeds the greatest daytime negative difference is during higher speeds which reduces the heat built up that if there were less wind. The highest wind speeds during the day however saw positive differences and this would be associated with hot N or NW winds.
Humidity
Relative humidity (RH) measured by the VP2 uses a Sensirion SHT31 combined temperature and humidity sensor (PN Junction Silicon Diode) and is contained within the radiation shield. This was compared with the humidity sensor of the La Crosse WS-2306 (WS2300-25S sensor) contained with the temperature sensor mounted on brick veneer of the site dwelling. Software generated dew point is computed from RH and temperature. The VP2 has a nominal accuracy for RH of +/-3 % updated once per minute. The La Crosse sensor is of an unknown lower accuracy (estimated at +/-9 to 12 %) compared to the VP2. Similar to the temperature data the siting and the accuracy of the La Crosse sensor means that it is not as accurate nor as responsive as the VP2 and in an overly sheltered site resulting in generally higher daytime relative humidity and is less responsive to changing conditions.
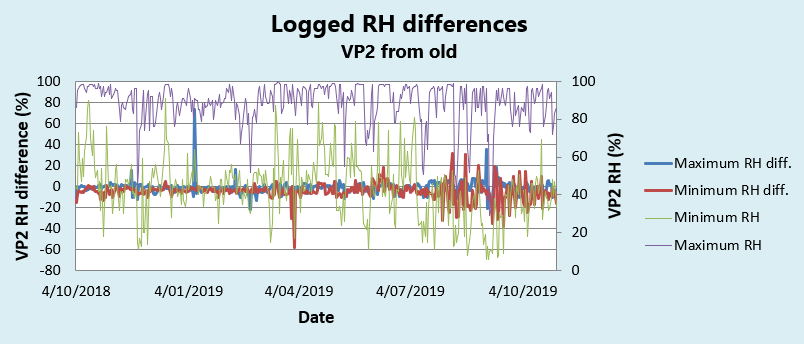
Figure 4 - Logged daily minimum and maximum RH by the VP2 and the difference of the VP2 from the old equipment for the comparison period. Differences are generally consistent throughout the comparison period except for the period of low humidity at the end of the period, though maximum relative humidity (generally overnight) is not affected to a great extent compared to the minimum values.
During the comparison period (Table 5) the mean RH observed by the VP2 was 3 % lower than the La Crosse sensor. The monthly mean RH difference ranged between -1.2% in June 2019 and -4.7% in March 2019. Mean maximum relative humidity was -1.1% for the difference of VP2 sensor compared to the La Crosse sensor which ranged between -4.2% in February 2019 and +0.7% in August 2019. The mean minimum RH difference was lower at -4.9 %, which ranged between +0.1% in June 2019 and -9.5% in September 2019. Most of the monthly differences were between +0.1 % in June 2019 and -4% in November 2018 and May and June 2019. Numerous periods of extremely low humidity saw the monthly mean minimum RH in July to October 2019 of between -6.4 % and -9.5 % (September 2019). During this same period in 2018 the RH of the La Crosse observed a similar mean minimum RH. Figure 4 shows the daily differences and the minimum and maximum daily RH logged by the VP2. This shows generally consistent differences with the exception of the aforementioned dry air at the end of the comparison period.
Due to the nature of electronic humidity sensors and their lower accuracy compared to temperature sensors these differences are reasonable. To partially deal with the siting of the La Crosse sensor the daily maximum relative humidity from the La Crosse sensor used a +10% offset for its final result. The logged 5 minute interval data between the two sensors which had no corrections applied showed a linear correlation over the mid and high range of values (Figure 5). The low end at below 30% shows an under-reading bias, whilst the upper end shows an over-reading bias. This is acceptable as this illustrates the difference in siting and accuracy of the old sensor. As a result numerous station records for RH were broken mostly for minimum, mean minimum and mean RH values. The highest RH recorded by the VP2 was 99% on 22 October 2018 (100% on 13 October 2018 from the La Crosse sensor) while the lowest was 6 % compared to 14% observed by the La Crosse on 4 September 2019.
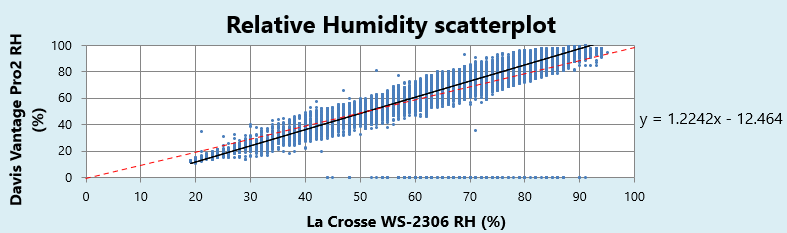
Figure 5: 5 minute logged RH data of Davis VP2 vs. the La Crosse sensor between 4 October 2018 and 31 March 2019 with 51, 286 matching data points. The red line is the prefect trend line and the solid black line is the linear ideal agreement trend where the dots above the trend line show the VP2 higher than the La Crosse and points below the trend line show the VP2 lower than the La Crosse.
Similarly for the dew point the mean difference of the VP2 from the La Crosse was -2.4 ºC with a mean of 14 ºC compared to a mean of 16.4 ºC as observed by the La Crosse sensor (Table 5). During most months the monthly differences were between -1.3 ºC in June 2019 and -0.5 ºC in April 2019. The lower humidity in August to October 2019 resulted in lower monthly mean dew point of -1.8 ºC in August, -2.5 ºC in September and -1.3 ºC in October. The mean maximum dew point difference was -0.7 ºC (25.3 ºC for the VP2 and 26.4 ºC for the La Crosse) and this ranged between -0.5 ºC in October 2018, March to May 2019 and August 2019 and -1.2 ºC in February 2019. Mean minimum dew point difference was slightly lower at -1.4 ºC and for most months this ranged between -0.6 ºC in October 2018 and April 2019 and -1.5 ºC in March and July 2019. In August to October 2019 the mean monthly difference was lower at -2.7 ºC in August, -3.2 ºC in September and -1.5 ºC in October as a result of the lower humidity. Daily differences between the two sensors saw some variability and to the greatest extent in August to September 2019 when very low dew point was recorded, shown in Figure 6.
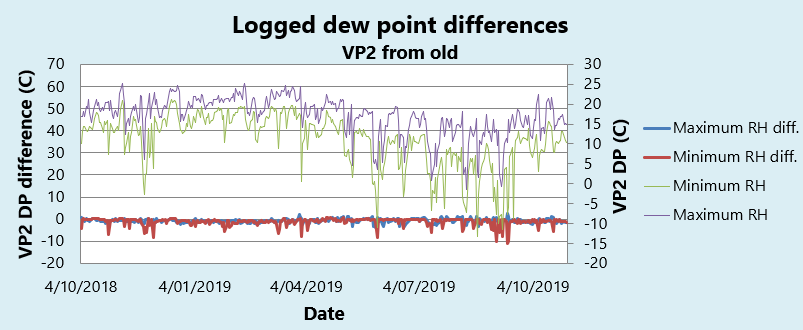
Figure 6: Logged daily minimum and maximum dew point by the VP2 and the difference of the VP2 from the old equipment for the comparison period. Differences are generally consistent throughout the comparison period but showed limited variability except for the period of low humidity at the end of the period.
Between the two sensors the logged 5 minute interval data for between October 2018 and March 2019 showed a consistent negative bias in the correlation across this range of observations made. As shown in Figure 7 this negative bias is a more pronounced towards the lower end of the range as this illustrates the difference in the exposure between the old and new sensors. As a result many records for mean, mean minimum and minimum dew point were broken. These results are quite reasonable and also considering the fact that dew point is a derived calculation. The highest dew point recorded by the VP2 was 25.3 ºC on 6 November 2018 compared to 26.4 ºC on 13 February 2019 by the La Crosse while the lowest was -13.2 ºC on 6 September 2019 compared to -3.6 ºC observed by the La Crosse on 9 September 2019.
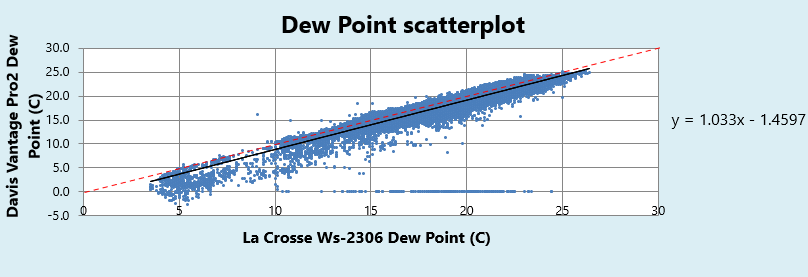
Figure 7: 5 minute logged dew point data of Davis VP2 vs. the La Crosse sensor between 4 October 2018 and 31 March 2019 with 51, 286 matching data points. The red line is the prefect trend line and the solid black line is the linear ideal agreement trend where the dots above the trend line show the VP2 higher than the La Crosse and points below the trend line show the VP2 lower than the La Crosse.
MSL pressure
MSL (Mean Sea Level) pressure has been measured by the pressure sensor contained within the indoor receiving console of the La Crosse WS-2306 since October 2011. These sensors are usually mounted indoors away from heat sources. This sensor has performed quite well with regular calibration checks referencing the nearest Bureau of Meteorology station to ensure the accurate reporting of air pressure reduced to sea level pressure. Generally little drift in the calibration have previously been observed. The VP2 likewise uses a pressure sensor in the indoor receiving console installed next to the La Crosse receiving console. The nominal accuracy of the VP2 pressure readings is +/- 1 hPa. Monthly mean MSL pressure calculate from daily minimum and maximum values and logged 5 minute readings from both instruments were used for the comparison.
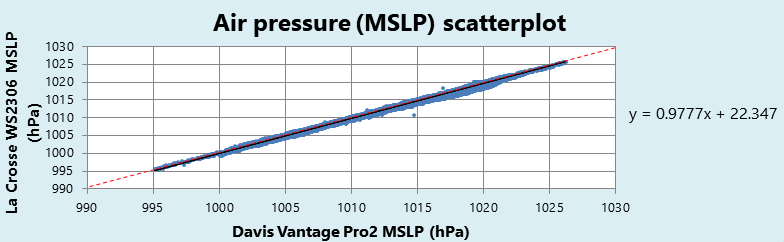
Figure 8: 5 minute logged MSL pressure data of Davis VP2 vs. the La Crosse sensor between 4 October 2018 and 31 March 2019 with 51, 286 matching data points. The red line is the prefect trend line and the solid black line is the linear ideal agreement trend where the dots above the trend line show the VP2 higher than the La Crosse and points below the trend line show the VP2 lower than the La Crosse.
Over the comparison period the level of agreement between the two sensors was excellent where the mean difference was +0.29 hPa (Table 6). The highest monthly difference was +0.51 hPa and lowest was +0.18 hPa. 5 of these months saw of difference of +0.2 hPa. All but 12 days out of 393 days saw the daily mean MSL pressure difference of within 0.9 hPa. The lowest pressure observed was 995 hPa on 28 November 2018 (995.4 Hpa measured by the La Crosse) and the highest was 1032 hPa on 7 June 2019 (1032.6 hPa measured by the La Crosse).
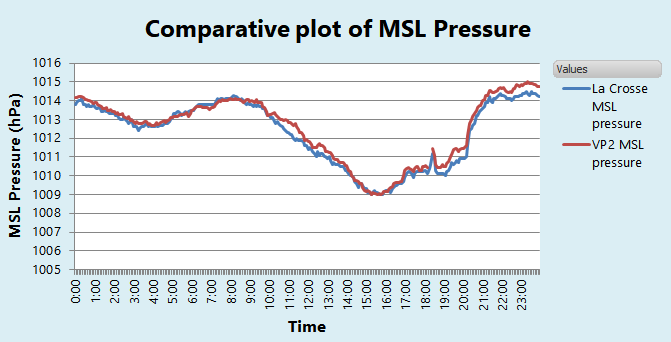
Figure 9: The plot shows the 5 minute logged MSL pressure data of the two sensors for 10 October 2018 showing the good agreement to the minute-by minute changes.
There was no indication of any calibration drift and retained consistent readings as checked against the Bureau of Meteorology Brisbane site (Table 7). It is clear that being calibrated against a known good source that the accuracy is much higher than the stated nominal accuracy. The difference of the mean pressure as compared to the Bureau of Meteorology Brisbane site during the comparison period was +0.02 hPa which is an excellent result (monthly mean pressure ranging between -0.12 hPa and +0.15 hPa).
The logged 5 minute interval data for between October 2018 and March 2019 showed a consistent correlation at high and low pressure as compared between the two sensors as shown in Figure 8. This is significant agreement considering that the La Crosse sensor is expected to have a lower accuracy and this was not anticipated.
As Figure 9 shows there was also generally good agreement between the logged 5 minute readings of the minute to minute variations.
Rainfall
The La Crosse station previously in use measured rainfall using a small tipping bucket rain gauge (TBGR), sensor: 2300-16 which used quite a small rectangular shaped funnel. This was mounted on a flat surface adjacent to the roof of the site dwelling with the top of the funnel at 2.3 metres above ground level. It of the twin tipping bucket design where rainfall flowing from the funnel filled up one bucket, then drops down when full (activating an adjacent reed switch) which empties the collected water allowing the other bucket to fill up. These sensors can be inaccurate due this tipping motion and require to be installed perfectly level. This rain gauge is considered to be of low accuracy (estimated to be +/- 20%) due to the siting location and height, funnel shape, size and the resolution of each tip is 0.5 mm instead of the standard 0.2 mm. The shape of the funnel is an issue during windy conditions where non-round shaped funnels cause wind deflection and alter the wind flow around the gauge ultimately affecting recorded rainfall. For these reasons the output from this gauge was not used as the gauge for the climatological totals for the site, where the 0.5 mm resolution is too coarse for this purpose. However it was very useful for recording the time and duration of rainfall as well as rainfall intensity.
Climatological totals have been always been measured at this site closer to the ground using a Nylex 2000 plastic 250 mm rain gauge. This is a manually read gauge. The Nylex gauge has been installed at about 1.5 metres above ground level attached to a steel open mesh fence. However due to a growth of vegetation over time which altered the record it was decided that an additional gauge be installed from April 2018. This location was adjacent to the VP2 that was installed in October 2018. Following a successful comparison this gauge became the gauge for climatological records of the site from August 2019. This new location will continue to be compared with the old location for a minimum of 3 years ending in April 2021.
Similar to the La Crosse station the VP2 rain gauge (#6465) is used for time period and intensity records but not for climatological records. It does however measure to a resolution of 0.2 mm and used a round funnel that meets the funnel size as specified by the World Meteorological Organisation. This is also a tipping bucket rain gauge mounted as level as possible. Mounting and maintaining the gauge level is quite difficult, which is essential for accurate rainfall reporting. The rain gauge is mounted above the radiation shield of the temperature and humidity sensor where the top of the funnel rim is at about 1.7 metres above ground level. It is worth noting that this is much lower than the La Crosse gauge and higher than the official standard of 0.3 metres above ground. However due to site restrictions measuring at ground level would result in under catch of rainfall due to surrounding obstructions. Rain gauges mounted at height results in more wind blowing the rain out of the gauge which resulting in under catch of rainfall. The Nylex rain gauge adjacent to the VP2 was installed at 1.4 metres above ground level initially and 1.7 metres from 4 October 2018.
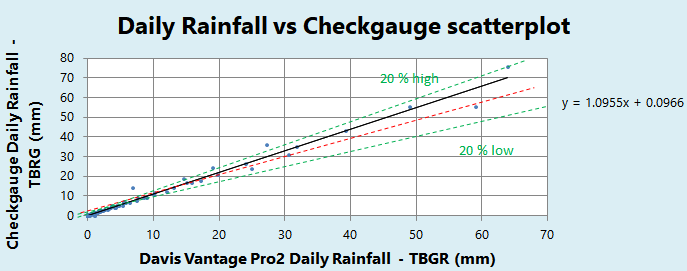
Figure 10: Daily rainfall totals of Davis VP2 vs. the standard check gauge between 4 October 2018 and 31 October 2019. The red line is the prefect trend line (slope of 1) and the solid black line is the linear ideal agreement trend where the dots above the trend line show the VP2 higher than the check gauge and points below the trend line show the VP2 lower than the check gauge. The low end of the values saw values clustered close to the trend line and much scatter for higher rainfall amounts.
For a uniform comparison the VP2 rain gauge was compared to the adjacent Nylex gauge even though it was not the official climatological gauge for most of the comparison period and also compared with the La Crosse gauge. Note as discussed earlier in this comparison that 5 minute interval data for the La Crosse station ceased to operate from 1 April 2019. This resulted in less correct daily totals from this point with several days of unknown values due to the La Crosse not directly measuring daily rainfall totals. To compare the VP2 against the La Crosse 0000 to 0000 local time was used for the daily rollover, while for the VP2 against the Nylex gauge 0900 to 0900 was used. 0900 to 0900 is the standard time period for reporting daily rainfall.
Table 8 outlines the totals by month for the three rain gauges and the differences of the VP2 from the two comparison gauges, where the Nylex gauge is the official check gauge. Figure 10 shows the correlation of the VP2 gauge vs the adjacent check gauge.
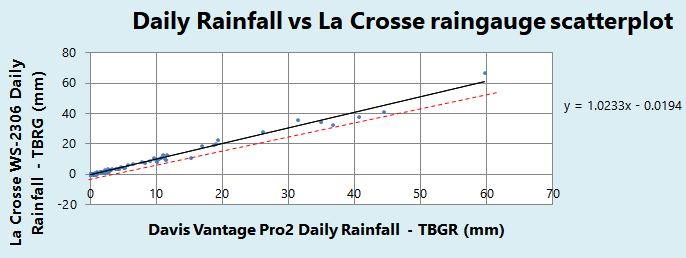
Figure 11: daily rainfall totals of Davis VP2 vs. the La Crosse rain gauge between 4 October 2018 and 31 October 2019. The red line is the prefect trend line (slope of 1) and the solid black line is the linear ideal agreement trend where the dots above the trend line show the VP2 higher than the La Crosse gauge and points below the trend line show the VP2 lower than the La Crosse. The low end of the values saw values clustered close to the trend line and some scatter for higher rainfall amounts.
It can be seen that these results are erratic by day and month with no obvious explanation for this variation. Also the total rainfall recorded is considerably lower than the check gauge mounted adjacent to the VP2. The total as compared with the La Crosse station was unexpectedly extremely similar. The correlation of the daily rainfall totals of the VP2 compared to the check gauge and La Crosse by day was tightly clustered to a greater extent at lower totals but consistently read low or high at the higher totals as shown in Figure 10 and 11. These differences at higher totals were worst as compared to the check gauge and not as bad with the La Crosse gauge.
During the comparison period the difference of the VP2 rainfall from the check gauge was reasonable. The check gauge measured a total of 886.9 mm (88.4 % of the long term average) whilst the VP2 observed 783.4 mm, which is a difference of -13.6 %. It was expected to under-read to some degree due to the fact that tipping buckets generally don’t measure intense rainfall as accurately as standard rain gauges. Table 8 however shows that significant variations occurred in the monthly differences of the VP2 from the two comparison gauges. The worst performing months were during months of low rainfall totals from light showers that dominated the rainfall observed in those months. This aspect was not anticipated and the monthly differences from the check gauge ranged from -39.3% of the check gauge total in October 2019 (29.2 mm vs 48.1mm) and +6.8% of the check gauge total in August 2019 (12.6 mm vs 11.8 mm).
The La Crosse gauge measured a total for the comparison period of 780.2 mm which was 0.4% lower than the VP2. The difference of the VP2 from the La Crosse for each month was within 10% for most of the months ranging from +27.3% high in January 2019 and -9.9 % low in February 2019. Most of the months that saw differences greater than 10% were during months with low rainfall where the low resolution of the La Crosse gauge affected the difference.
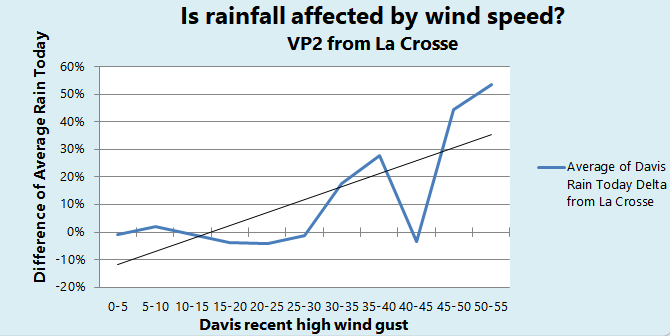
Figure 12: Difference of the daily VP2 rainfall as compared to the La Crosse gauge for the difference in rainfall since midnight from logged 5 minute observations between 4 October 2018 and 31 March 2019. This shows that the two gauges performed similarly at lighter winds and the La Crosse in a generally linear trend recorded less rain than the VP2 at higher wind speeds
To determine why these inconsistent differences of the VP2 rainfall totals occurred as compared with the two other gauges the effect of the wind on observed rainfall was checked. The result of this check shows that for the period between 4 October 2018 and 31 March 2019 that there was no correlation of reduction in rainfall since midnight to the wind gusts from the logged 5 minute observations. This shows that the effect of the wind on rainfall measured by the VP2 compared to the elevated La Crosse gauge is similar at low wind gusts and records higher totals during higher wind gusts. This demonstrates that the elevated La Crosse gauge under-reports in rainfall with wind. There may have been other differences caused by the wind which can only be fully proven by a near ground level gauge of which is not possible with this comparison. This result is shown in Figure 12 and Table 9.
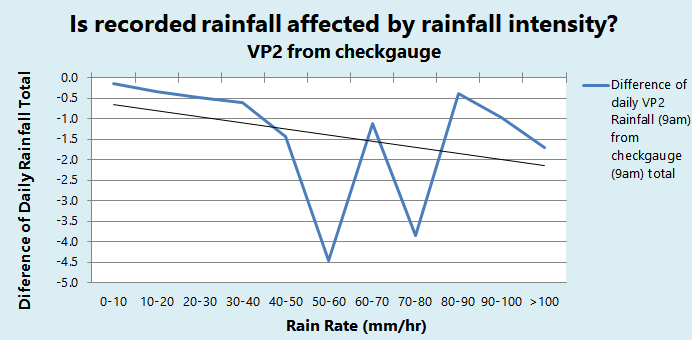
Figure 13: Difference of the daily VP2 rainfall from the check gauge. This clearly demonstrates the negative fall in rainfall in more intense rainfall, though the results are quite erratic. The differences are less at lower rain rates.
The next aspect that has been checked is the relationship of the VP2 daily rainfall by rainfall intensity. The VP2 is very sensitive to measuring rainfall intensity with new records observed as a result. Figure 13 and Table 10 shows on average that there is a distinct downward trend in rainfall as the rainfall intensity increases.
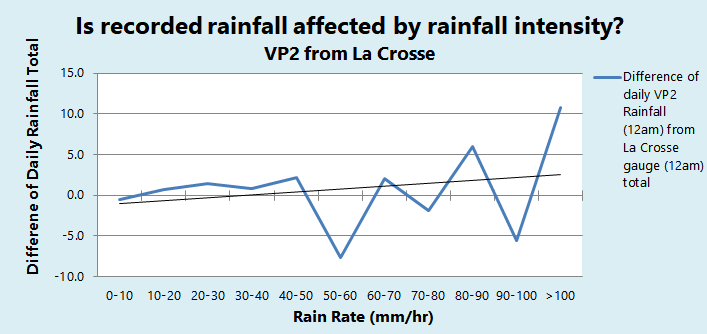
Figure 14: Difference of the daily VP2 rainfall from the La Crosse gauge by rainfall intensity. This clearly demonstrates the erratic nature of this difference and shows that generally the VP2 gauge performed better than the La Crosse at higher rain rates, while the totals were similar at lower rain rates.
There are exceptions but it is clear that the totals are closer to the check gauge below 50 mm/ hr which is the threshold at the station as the definition for heavy rainfall. However this trend is very erratic and clearly demonstrates the unreliable nature of the rainfall data collected in high intensity rainfall. This is an important consideration that during the warm-season much of the rainfall is produced from thunderstorms with heavy rainfall. As compared with the La Crosse gauge the performance was similar below 50 mm/hr and performed generally better at higher rates and but was much more erratic than the comparison to the check gauge (Table 11 and Figure 14). This is probably caused by the lower accuracy of the La Crosse gauge in very intense rainfall. On average much of the high rainfall rates recorded by the VP2 saw higher totals than the La Crosse station which is not surprising considering being a much larger rain gauge.
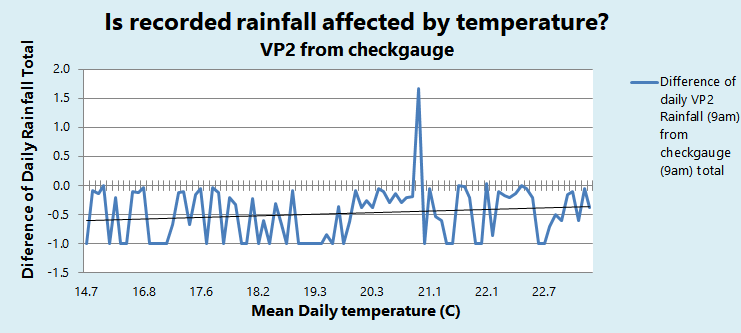
Figure 15: The difference of recorded rainfall by the VP2 from the check gauge shows no significant correlation to mean daily temperature.
Looking at the rainfall difference from the check gauge according to mean daily temperature shows little correlation albeit a slight negative trend in the rainfall difference at higher temperatures. This doesn’t demonstrate any significance relating to the recorded rainfall as shown in Figure 15 and Table 12.
The next check is to identify whether there is any link to these differences to the daily rainfall totals, .e.g. is there a trend in this observed difference at higher and lower rainfall amounts. Table 13 lists these results and when grouped rainfall totals of the VP2 are analysed in comparison to the check gauge that generally the difference is lower at greater rainfall totals. One aspect that this data shows is that there were a high number of low rainfall totals that the check gauge measured that the VP2 didn’t measure. Based on subjective observations this is probably related to the fact that the VP2 funnel is much larger and takes a little more rain to wet to get run-off into the buckets that the check gauge which is much more sensitive to very low rainfall using a smaller funnel.
It was noticed at the time when light showers of less than 0.2 mm was interspersed with sunshine that none or only 0.2 mm was measured by the VP2 while the check gauge measured a higher total. During 75 days of 0.1mm to 0.9 mm measured by the check gauge on 53 of these days the VP2 measured no rainfall. The number of days that the rainfall recorded by the check gauge was entirely produced by overnight dew was 23 days. The rainfall as measured by the check gauge caused by the dew was 3mm with the VP2 only measuring rainfall on one of these days with 0.2 mm on the 4 August 2019. The poor performance of measuring the days of dew only had a minor impact on the rainfall totals where the larger issue is the under-reporting during the days of low rainfall totals. Excluding the days of dew the check gauge saw a total of 17.8 mm on 52 days while the VP2 measured less than half of that with a total of 6.6 mm on 20 days where the highest total was 0.8 mm on 10 January 2019 though most daily totals were 0.2 mm or 0.4 mm. The number of single-tip days observed by the VP2 gauge was 14 days (0.2 mm) while the same number of days of up to 0.2 mm excluding dew days recorded by the check gauge was 22 days.
The La Crosse gauge saw 20 days of only one tip of the gauge (0.5 mm) compared to 20 days for the the VP2 gauge number of single-tip days (0.2 mm). However the number of days of 0.4 mm by the VP2 was 30 days and 38 days of 0.6 mm. From this it can be seen that the La Crosse also experience this anomaly but more significantly. This aspect significantly affected the number of days that the La Crosse gauge saw rain where a total of 29 days of 1 mm of less compared to 43 days of 1 mm or less recorded by the VP2 gauge. The La Crosse 0.5 mm resolution would have had an impact on this. Interestedly but probably related to the large funnel of the VP2 causing the under-reading on low rainfall totals that of the 30 days of single-tip days observed by the VP2 that the La Crosse measured 7 days of a single tip (0.5 mm).
As mentioned earlier in this rainfall comparison and as shown in Figure 10, it can be determined that with the erratic nature of the observed rainfall that this be cannot be caused by an error in calibration. For this highly variable and quite random nature of the difference observed by the VP2 gauge there is no clear weather or instrument cause for incorrect reporting though some of these factors contributed to some degree. While this gauge was not expected to match closely to the check gauge consistency the differences appears to be result of the under-lying nature of the design of the rain gauge.
These differences also showed up in the total number of rain days of at least 0.1 mm on the check gauge (24 hours to 9am), 0.2 mm on the VP2 gauge (24 hours to 9am) and 0.5 mm (24 hours from midnight) on the La Crosse gauge. The number of rain days observed by the check gauge excluded the days where the rainfall was entirely the result of dew. Table 14 lists the totals, rain days and wet days of the three gauges. Wet days are the number of days of at least 1 mm. The VP2 measured a total of 121 wet days compared to 171 days of the check gauge and higher than the La Crosse gauge (81 days). Rain days also showed differences with the VP2 measuring 121 days compared to 143 days from the check gauge and 103 days by the La Crosse gauge.
The final check for this comparison was to take a closer inspection of the days with the greatest differences in observed rainfall totals looking only at the days when each gauge of this comparison observed some rainfall, otherwise the difference is obviously -100 %. As compared to the check gauge the greatest under-reporting difference of the VP2 24 hours to 9am rainfall was -71.4 % on two occasions, namely the 8 December 2018 and 14 May 2019 when the check gauge observed 0.7 mm and the VP2 measured 0.2 mm on both days. For the daily total on 8 December 2018 there were brief showers in the late morning, late afternoon and late evening where the VP2 measured the 0.2 mm in the late afternoon of the 7 December and the La Crosse didn’t measure rainfall. This instance is a good example of the under-reporting at low rainfall totals. The daily total as measured on the 14 May 2019 was as a result of drizzle during the morning then clearing with some drizzle in the mid afternoon during the 13 May. This again demonstrates the effect of light rainfall with dry breaks between showers.
By contrast the greatest over-reporting of the VP2 gauge was +166% as compared to the check gauge when the VP2 measured 0.8 mm on 27 March 2019 compared to 0.3 mm by the check gauge. The observed rainfall is a result of occasional light rain/ drizzle early before light rain periods from 8am through to this observation at 9am. The La Crosse gauge observed 0.5 mm. This shows the reverse behaviour in that this performed better than the check gauge for no apparent reason.
A look at the extremes of the percentage differences of the VP2 rainfall (24 hours from 12am) compared with the La Crosse gauge showed the greatest under-reporting (-66.7%) was 0.2 mm compared with 0.6 mm measured by the La Crosse gauge on the 4 April 2019 during some light brief showers early in the day; the highest over-reporting occurred on the 16 April 2019, 3 May 2019 and 20 October 2019 where the VP2 observed 1.0 mm and 0.5 mm by the La Crosse gauge (+100%). The 16 April 2019 was light showers in the late morning and early afternoon, while the 3 May 2019 was early morning light showers and brief light showers in middle of the day until mid-afternoon. This could be a case being of a low rainfall amount that was not quite enough rain for the La Crosse gauge to get to the second tip of the bucket. The 20 October 2019 rainfall was light showers in the mid-morning of 19 October 2019, followed by a moderate thunderstorm with some heavy rain at 11:40 am, a light early afternoon shower and a late afternoon decaying thunderstorm and light shower.
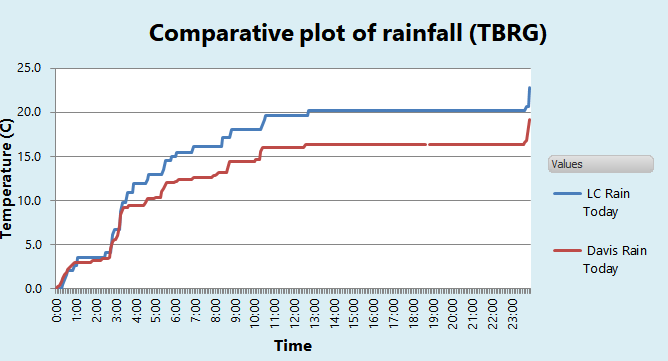
Figure 16: This is the logged rainfall data over time for the 6 February 2019 showing the La Crosse and VP2 gauge. This shows a distinct under-reporting of the VP2 gauge compared to the La Crosse gauge though both gauges tracked close together early in the day.
Looking at the daily totals compared to the La Crosse gauge for daily totals of at least 5 mm as recorded by the VP2 saw the greatest under-reporting on the 6 February 2019 where the VP2 measured 19.2 mm compared to 22.8 mm by the La Crosse gauge (-15.8%). Figure 16 shows the logged rainfall from both gauges on this day with light to moderate frequent showers in the early hours and during the morning, becoming less frequent during the late morning and clearing in the early afternoon. A light to moderate shower followed with heavy falls in the late evening with light winds over the day.
Also on the 12 October 2019 the same percentage difference occurred with the VP2 measuring 9.6 mm and the La Crosse measuring 11.4mm from light showers and rain at times from 4 am, brief heavy falls at 7am, easing at 9am, returning in the late morning and clearing at midday, with some gusty winds.
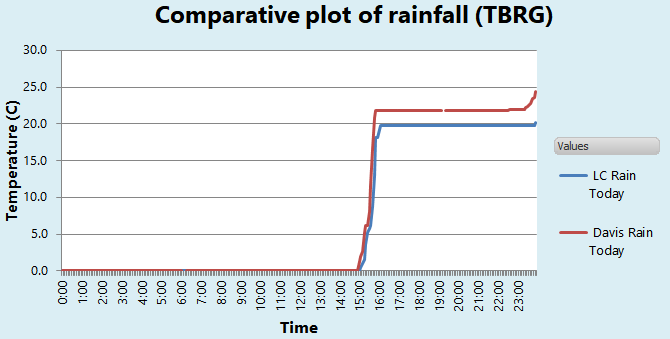
Figure 17: This is the logged rainfall data over the day of the 5 October 2018 showing the La Crosse and VP2 gauges rainfall. This shows a consistent over-reporting of the VP2 gauge compared to the La Crosse gauge though with excellent agreement on the timing of the rainfall.
Conversely the greatest over-reporting was on the 11 October 2019 where the VP2 measured 15.2 mm and the La Crosse gauge saw 10.9 mm (-39.4 % less than the VP2 gauge). On this day were a midday mild brief thunderstorm and a mild mid-afternoon thunderstorm, followed by a mid-evening mild thunderstorm with brief heavy falls and thundery showers in late evening with heavy falls. As this occurred after the end of the logging of 5 minute rainfall totals by the La Crosse gauge when this over-reporting is analysed for the period between October 2018 and March 2019 the highest over-reporting as compared to the La Crosse was +15.6 % on the 5 October 2018 where the VP2 measured 25.2 mm and the La Crosse measured 21.8 mm (-3.4 mm). This was from light showers in the late morning, mid-afternoon moderate thunderstorm with heavy rain and evening showers becoming light to moderate rain at times. Figure 17 depicts the logged data from the two gauges and clearly shows that the VP2 measured a consistently higher rainfall total as compared to the La Crosse gauge.
Comparing the greatest over-reporting of the VP2 gauge against the check gauge at totals of at least 5 mm gives 59 mm compared to 55.3 mm on the 6 October 2018 (6.7% higher than the check gauge). Conversely the greatest under-reporting of the VP2 gauge was on the 7 October 2018 where the VP2 measured 6.8 mm and the check gauge measured 14.4 mm (52.8% low).
The rainfall on the 6th was from light showers in the late morning of the 5th, following by a mid afternoon moderate thunderstorm with heavy rain. Then there were showers in the evening quickly becoming light to moderate rain at times. On the 6th there was thundery midnight rain with heavy falls, easing to light to moderate from 12:45am and light from 2am, clearing from 4 am, followed by drizzle in the morning with brief light showers. The rainfall on the 7th was from several light showers in the late morning and early afternoon of the 6th, followed by showers in the late afternoon and evening.
It is evident from this comparison that reliable climatological rainfall totals from the VP2 rain gauge is impossible as a result of the inconsistent measurements that it makes. Therefore the check gauge will continue to be the primary rain gauge for climatological records (daily and monthly totals). As compared with the previous TBRG (La Crosse) in use that it generally measures data of higher quality (improved rainfall measuring in high intensity rainfall and windy conditions) and will continued to be very suitable for recording rainfall intensity and timing. It should be noted that there are differences in the logged rainfall intensity as the rainfall rate for the La Crosse gauge was calculated from rainfall over a 5 minute interval while the VP2 gauge was measured based on the amount of elapsed time between the tips of the rain gauge buckets.
As a side-note Table 15 outlines the on-going comparison between the check gauge at the old location and the new relocated gauge adjacent to the VP2 for the period between April 2018 and October 2019.
Wind
Wind speed and direction have previously been measured using an anemometer (spinning cups type) and wind vane sensor of the La Crosse station WS-2306 (TX-20 sensor) mounted adjacent to the site dwelling roof at eaves level (2.4 metres). This siting was less than ideal and was unduly affected a large degree of the impact from the nearby roof and some degree by nearby trees. This sensor was used for measuring wind speed and direction from September 2011 replacing the previously used wind sensor from the La Crosse WS-1600-IT. The sensor samples and transmits the data once every 128 seconds. Due to the siting and the low sampling interval this sensor generally measured wind gusts quite poorly with an apparent over-reading in gusty conditions. On 24 December 2017 the wind direction stopped reporting and from December 25 2017 the La Crosse WS-1600-IT was brought back into use for providing 3 hourly wind direction readings before failing on 26 September 2018.
The wind speed and direction data from the La Crosse WS-2306 was retrieved from the electronic logged data (through the data logger) whilst the La Crosse WS-1600-IT data was manually retrieved from its receiving console. To produce reasonable results a calibration factor of 3.6 was used for the La Crosse WS-2306 and 5 for the La Crosse WS-1600-IT, otherwise the wind speeds was not representative at all to the wind speed at the site. The sensors provided maximum gust speed with the sustained 10 minute average wind speed estimated from the gust speed for the La Crosse WS-1600-IT until September 2011 and calculated from the logged data when the La Crosse WS-2306 was placed into use from September 2011.
The wind speed and direction as measured by the Davis Vantage Pro 2 anemometer (#6410 with spinning cups) and wind vane sensor is mounted much higher than the La Crosse sensor with the wind cups of the Anemometer at 3.8 metres above ground level. This was sited at the same location as the La Crosse sensor, next to the site dwelling roof. While still affected to some degree to the nearby roof and surrounding trees the sensor was mounted at top of the roof level. This is sheltered to the SW and NE to E by trees, with very good exposure to the NNW to NNE and reasonable exposure in the other directions.
It should be noted that the accurate measurement of wind speed and direction is one of the most difficult parameters to measure accurately. Therefore given this is being measured at a suburban site with varied roughness of the surrounding obstacles these readings are very site specific and not consistent with standard measuring practices. Standard official sites measure the wind at 10 metres in a well exposed location. The sensor samples and transmits the data every 2.5 seconds, thereby measuring wind gusts. The calibration factor of 1.8 for 10 minute average wind speed and 1.2 for wind gust was used and records both maximum wind gusts and sustained 10 minute average wind speeds.
The results of the old sensor against the new Davis sensor are not directly comparable due to the different siting and differences in how each sensor collects the data. It however does still provide a comparison of the changed reporting of the wind with the new sensor. No comparisons were made with wind direction due to the fact that there were no logged wind direction readings produced by the La Crosse sensor due to the equipment failure. The 3 hourly spot wind direction readings cannot be used as a useful comparison and also given that this sensor also failed a few days before the commissioning of the VP2. Also as noted earlier that the logged 5 minute observations of the wind speed (excluding wind direction having previously ceased) failed after 31 March 2019 so the comparison using this data is only for the period 4 October 2018 to 31 March 2019.
Comparing the starting speed of the Davis sensor with the La Crosse sensor shows that the Davis anemometer has a lower starting speed. Whilst the La Crosse sensors measures as low as 1 km/hr, this starting speed was not achieved until the Davis anemometer measured 6 to 8 km/hr (and 2 to 4 kph on occasions). The lowest speed that the Davis anemometer can measure down to is 2 km/hr. The stopping speed of the La Crosse as compared with the Davis is 2 km/hr. The wind vane of the Davis sensor is also more sensitive than the La Crosse sensor where the wind vane on the Davis anemometer will move when 2 km/hr is registered as compared with 4 to 6 km/hr (measured using the Davis) on the La Crosse unit.
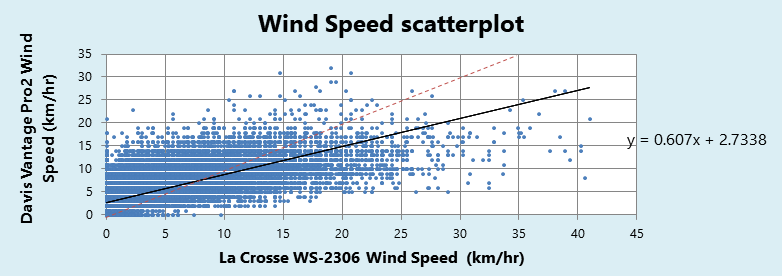
Figure 18: Wind speed of Davis VP2 anemometer vs. the La Crosse anemometer between 4 October 2018 and 31 October 2019. The solid black line is the linear ideal agreement trend where the dots above the trend line show the VP2 higher than the La Crosse sensor and points below the trend line show the VP2 lower than the La Crosse sensor. The red dashed line is the line of the prefect trend (slope of 1). The low end of the VP2 values saw much scatter and at higher speeds the VP2 was generally lower than the La Crosse.
Generally once the cups start moving during steady winds gusts are similar between the two sensors whilst in gusty conditions the La Crosse records much higher wind gusts when the Davis measures less variable wind gusts. The correlation of all the 5 minute logged observations shows no clear trend between the two sensors with a high degree of scatter. Wind speed was both below and above the La Crosse output (bias a little on the high end) at lower speeds but as wind speeds increase the Davis almost entirely report lower wind speeds (Figure 18).
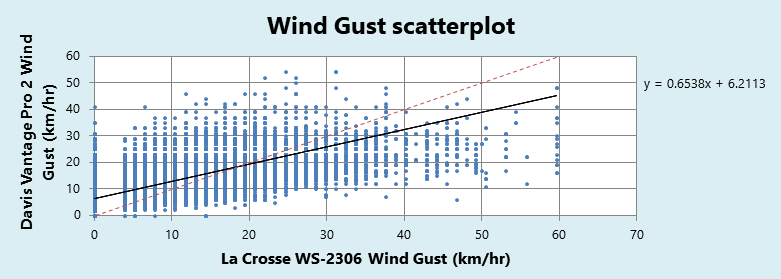
Figure 19: Wind gust of Davis VP2 anemometer vs. the La Crosse anemometer between 4 October 2018 and 31 October 2019. The solid black line is the linear trend line. The red dashed line is the line of perfect trend where dots above the trend line show the VP2 higher than the La Crosse sensor and points below the trend line show the VP2 lower than the La Crosse sensor. The low end of the VP2 values saw much scatter and at higher gusts was generally lower than the La Crosse.
Wind gusts showed a similar trend but generally reported higher wind gusts at the lower speeds and lower wind gusts when the La Crosse reported 30 km/hr or higher (Figure 19). This illustrates the differences in the sensors, siting and greater influence of the obstructions on the La Crosse station blocking the wind at lower speeds and affecting the data at higher speeds.
The logged mean monthly wind speed, daily mean of highest wind speed, daily mean of highest gust and the highest gusts by month for both anemometers are outlined in Table 16 and 17. The mean wind speed from the logged 5 minute during the period between October 2018 and March 2019 as recorded by the Davis anemometer were 45.7 % higher than the La Crosse anemometer (4.7 km/hr for the Davis anemometer and 3.2 km/hr for the La Crosse anemometer). There was variability in the month-to-month means ranging from 17.1% high for October 2018 and 73.3% high for March 2019. On the other hand on absolute terms the average difference for this period was +1.5 km/hr and ranged between +0.4 for October 2018 and +2.0 in January 2019.
The mean for the period between October 2018 and March 2019 for the highest daily 10 minute average wind speed was 41.6% lower than the La Crosse anemometer (13.2 km/hr for the Davis and 20.5 km/hr for the La Crosse). There was some variability in the month-to-month means ranging between a high of -23.2 % for March 2019 and to a low of -43.1% in October 2018. The absolute difference during this period was -7.1 km/hr and ranged from a low of -10.2 km/hr in February 2019 to -4 km/hr in March 2019. After the 5 minute logging using the La Crosse anemometer ceased from April 2019 the Davis anemometer measured a mean wind speed of the daily highest wind speeds for between April 2019 to October 2019 of 13.1 km/hr which was similar to 13.3 km/hr between April 2018 and October 2019.
For the mean of highest daily wind gusts the difference of the Davis anemometer as compared to the La Crosse was -20.9% where the Davis measured 26.6 km/hr and the La Crosse measured 33.7 km/hr. There was less variability in the month-to-month mean wind gusts compared to the mean wind speeds, with most months between -20% and -28% low (compared to the La Crosse) which ranged between a low of -27.8% in September 2019 and a high of -8.5% in October 2019. On absolute terms the difference saw a mean difference of -7 km/hr ranging between a low of -11.5 km/hr in September 2019 and a high of -2.3 km/hr in October 2018.
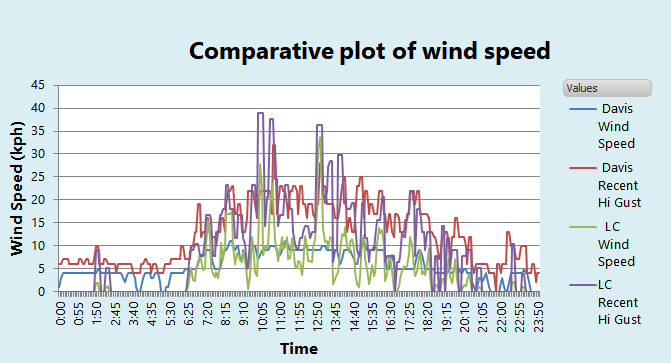
Figure 20: Wind plot on 9 December 2018 showing the variability of the wind speeds and gusts between the two anemometers. This plot clearly shows the overly variable speeds of La Crosse output (marked as LC) whilst the Davis output is more steady which demonstrates the better exposure obstructed less than the La Crosse anemometer mounted at a lower height. This also shows the lower sensitivity of the La Crosse sensor at the lowest wind speeds with very little wind early in the day whilst the Davis anemometer measured very light winds.
Monthly maximum wind gusts recorded by the Davis anemometer are generally lower than the La Crosse anemometer where the October 2018 to October 2019 mean difference was -20.9 km/hr The highest wind gust observed by the Davis of 56 km/hr on August 2018 and the La Crosse saw 80.3 km/hr on September 2018. The monthly difference of the highest wind gust recorded ranged between -8.5% in October 2018 and -27.8 % in September 2019.
These differences resulted in new records for mean wind speed and gust, highest wind speed and gust and wind run (summed mean wind speed for each day). The minute-to minute changes are quite variable and random (Figure 20); the monthly and period differences are reasonably constant which are not directly comparable with the pre-existing data. The anomalies from the long term average for this data have been rather abnormal as a result of these differences. This comparison will allow for long term averages to be adjusted allowing for the changes in the data reporting for this and other parameters. It should be note that the adjusted long term average of course is not suitable for the data before October 2018 which use the un-adjusted long term averages.
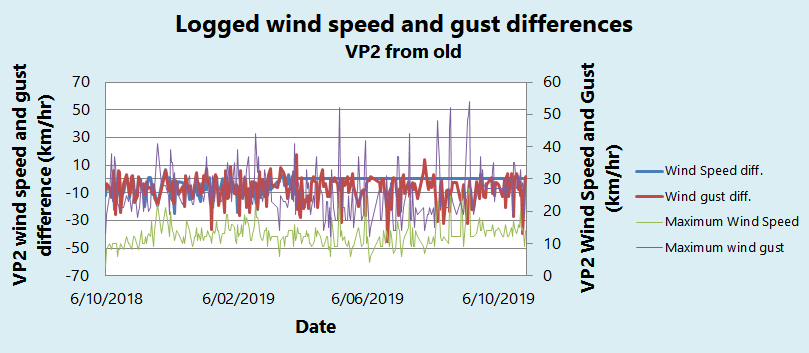
Figure 21: Logged daily minimum and maximum wind speed and gust by the VP2 and the difference of the VP2 from the old equipment for the comparison period. Day-to-day variability in the differences can be seen and also very consistent mean wind speeds.
Figure 21 shows the daily differences for the highest wind speed and gust where the difference is the VP2 anemometer from the La Crosse anemometer. The wind speed difference is for the period of October 2018 to March 2019 and wind gust difference is for October 2018 and October 2019.
This shows the very consistent daily peak wind speed and quite consistent differences while gusts are a lot more variable for the peak daily values and the differences. While most days recorded lower speeds and gusts as compared to the La Crosse anemometer there were however some days that wind gusts were higher. This clearly shows the variable nature of wind speeds and gusts, the impact of obstacles in the surrounding environment and that exact agreement cannot be expected. Subjective observations showed that the La Crosse anemometer was quite erratic in the measurement of wind speed relating to the wind at the site, which often would miss the gusts that were not helped by the low sampling rate. Conversely in very gusty conditions the wind gusts were unrealistically high which require adjustment occasionally post-event. However as the Davis anemometer is still sited quite low and affected by the roof and trees at the site to a lesser degree than the La Crosse anemometer, it should be noted that the data is not consistent with a standard exposure. However given the constraints of the site the recorded data of the Davis anemometer is more representative of the wind at the site than the La Crosse anemometer.
Conclusion
The current instrumentation was compared with the data recorded by the new VP2 to identify differences in the site record before the decommissioning of the old equipment. It was found that generally the sensors recorded data that were more representative of the location and of higher quality. The exception to this was the TBGR rain gauge which measured quite erratic rain totals but performed very well for rainfall intensity and timing. There were many differences in the VP2 data compared to the old data which doesn’t make the old and new data in the site record directly comparable.
However by taking into account the differences that this comparison has found, these changes result in improved quality of reported data and provide an indication of how the site record will change into the future compared to how it would be with the old equipment. In balance this equipment does not present a major negative affect on the site record. This evaluation clearly demonstrates the superior data that the Davis VP2 measured compared with the lower accuracy and lower grade weather station.
References
- Burt, Stephen (2009), Prodata Expert Guide No.1 – Davis VP2 AWS © Stephen Burt 2009 Online document, available from https://www.weatherstations.co.uk
- Burt, Stephen (2012), The Weather Observers Handbook, Cambridge University Press, measuringtheweather.com
- Bureau of Meteorology (2013), OBSERVATION SPECIFICATION NO. 2013.1 - GUIDELINES FOR THE SITING AND EXPOSURE OF METEOROLOGICAL INSTRUMENTS AND OBSERVING FACILITIES. Online document, available from http://www.bom.gov.au
- WMO GUIDE TO METEOROLOGICAL INSTRUMENTS AND METHODS OF OBSERVATION (the CIMO Guide) (2014). Online document, available from https://www.wmo.int
- Davis Instruments (2018), Wireless Vantage Pro2™ & Vantage Pro2™ Plus Stations Specs, Online document, available from https://www.davisinstruments.com
- Ferny Grove Weather (2019), About Ferny Grove Weather, Online document, available from https://fernygroveweather.com
Tables
Table 1: temperature comparison
This is the monthly mean and extremes of the temperatures during the 13 month comparison period. Positive difference show the VP2 was higher than the old sensor. Data is shown to 2 decimal places in order to compare the data whilst the accuracy of the sensors is much lower than this. Maximum temperatures are for the 24 hours from 12am and minimum temperatures are the 24 hours to 9am. Mean temperatures is the average of the mean minimum and maximum temperatures and not the average of the minute to minute logged data.
Temperatures averages and extremes comparison |
|||||||||||||
Month |
Mean Min Temp Old |
Mean Min Temp VP2 |
Mean Min Temp New Diff. from Old |
Mean Max Temp Old |
Mean Max Temp VP2 |
Mean Max Temp New Diff. from Old |
Mean Temp Old |
Mean Temp VP2 |
Mean Temp New Diff. from Old |
Min Temp Old |
Min Temp VP2 |
Max of Max Temp Old |
Max of Max Temp VP2 |
2018 |
|
|
|
|
|
|
|
|
|
|
|
|
|
Oct |
15.59 |
16.01 |
+0.42 |
27.46 |
26.69 |
-0.61 |
21.50 |
21.35 |
-0.11 |
10.5 |
11.4 |
34.6 |
34.6 |
Nov |
16.40 |
17.37 |
+1.06 |
31.80 |
30.50 |
-1.30 |
24.07 |
23.94 |
-0.10 |
11.1 |
12.6 |
35.2 |
37.2 |
Dec |
18.82 |
19.48 |
+0.66 |
31.58 |
30.41 |
-1.17 |
25.20 |
24.94 |
-0.26 |
14 |
14.9 |
38 |
39.8 |
2019 |
|
|
|
|
|
|
|
|
|
|
|
|
|
Jan |
20.17 |
20.83 |
+0.66 |
33.44 |
31.97 |
-1.53 |
26.80 |
26.40 |
-0.43 |
17.6 |
18.5 |
36.1 |
34.3 |
Feb |
20.21 |
20.88 |
+0.64 |
32.40 |
31.18 |
-1.23 |
26.33 |
26.03 |
-0.31 |
15.5 |
16.8 |
36.8 |
36.7 |
Mar |
20.20 |
20.41 |
+0.21 |
32.16 |
31.39 |
-0.77 |
26.18 |
25.90 |
-0.28 |
12 |
14.1 |
38 |
41.1 |
Apr |
15.87 |
16.41 |
+0.54 |
27.93 |
26.75 |
-1.25 |
21.85 |
21.58 |
-0.33 |
13.4 |
14.1 |
32.2 |
30.5 |
May |
12.38 |
13.12 |
+0.74 |
25.17 |
24.75 |
-0.43 |
18.77 |
18.93 |
+0.16 |
2.5 |
4.4 |
28 |
28 |
Jun |
9.89 |
10.88 |
+0.99 |
23.20 |
22.49 |
-0.71 |
16.55 |
16.68 |
+0.14 |
3.2 |
4.4 |
26.4 |
27.7 |
Jul |
8.15 |
9.58 |
+1.43 |
23.45 |
23.52 |
+0.08 |
15.80 |
16.55 |
+0.75 |
3 |
5.1 |
26.2 |
27.2 |
Aug |
8.25 |
9.75 |
+1.49 |
25.13 |
24.33 |
-0.80 |
16.69 |
17.04 |
+0.35 |
5 |
6.2 |
27.6 |
28.6 |
Sep |
10.68 |
12.09 |
+1.41 |
28.64 |
28.22 |
-0.67 |
19.71 |
20.15 |
+0.36 |
5.6 |
6.9 |
31.9 |
35.3 |
Oct |
13.70 |
14.58 |
+0.88 |
29.36 |
27.91 |
-1.45 |
21.53 |
21.25 |
-0.29 |
8.2 |
9.2 |
33.8 |
34.7 |
|
14.6 |
15.46 |
+0.86 |
28.0 |
27.7 |
-0.91 |
21.6 |
21.6 |
-0.02 |
2.5 |
4.4 |
38 |
41.1 |
Table 2: frequency of daily temperature differences
This shows the frequency of the differences within certain tolerances of the VP2 compared to the old equipment for daily minimum and maximum temperatures over the 13 month comparison period. A positive difference is when the VP2 is higher than the old equipment and conversely for the negative differences. Maximum temperatures are for the 24 hours from 12am and minimum temperatures are the 24 hours to 9am.
Days within tolerances for daily minimum and maximum temperatures |
|||||||||||||||
|
+/- 0.1 C |
+/- 0.2 C |
+/- 0.3 C |
+/- 0.4 C |
+/- 0.5 C |
+/- 1.0 C |
+/- 1.5 C |
+/- 2.0 C |
Min Diff. from Old |
Max Diff. from Old |
Mean Diff. from Old |
n days |
|||
Minimum Temperature |
|||||||||||||||
Count of days |
6 |
23 |
44 |
64 |
94 |
222 |
328 |
364 |
-1.3 |
+4.4 |
+0.9 |
393 |
|||
% Cumulative Frequency |
1.5 |
5.9 |
11.2 |
16.3 |
23.9 |
56.5 |
83.5 |
92.6 |
|||||||
Maximum Temperature |
|||||||||||||||
Count of days |
10 |
33 |
46 |
61 |
75 |
141 |
213 |
273 |
-6.6 |
+9.7 |
-0.9 |
393 |
|||
% Cumulative Frequency |
2.5 |
8.4 |
11.7 |
15.5 |
19.1 |
35.9 |
54.2 |
69.5 |
|
||||||
Table 3: Temperature differences by hour
This is the hourly average temperature logged as the difference of the VP2 from the La Crosse by month for the 6 months between October 2018 and March 2019. A positive difference is when the VP2 is higher than the old equipment and conversely for the negative differences.
Davis Out Temp Delta from La Crosse WS 2306 by hour and month |
|||||||
|
Month |
|
|||||
Hour |
Oct 2018 |
Nov 2018 |
Dec 2019 |
Jan 2019 |
Feb 2019 |
Mar 2019 |
Mean |
0 |
-1.5 |
-2.1 |
-1.8 |
-2.0 |
-1.7 |
-1.7 |
-1.8 |
1 |
-1.4 |
-2.1 |
-1.8 |
-2.0 |
-1.8 |
-1.7 |
-1.8 |
2 |
-1.4 |
-2.1 |
-1.7 |
-1.9 |
-1.7 |
-1.7 |
-1.8 |
3 |
-1.4 |
-2.0 |
-1.6 |
-1.9 |
-1.6 |
-1.6 |
-1.7 |
4 |
-1.4 |
-1.8 |
-1.6 |
-1.9 |
-1.6 |
-1.6 |
-1.7 |
5 |
-1.3 |
-1.6 |
-1.5 |
-1.8 |
-1.5 |
-1.5 |
-1.5 |
6 |
-0.9 |
-0.7 |
-0.7 |
-1.2 |
-1.2 |
-1.4 |
-1.0 |
7 |
-0.1 |
-0.3 |
-0.3 |
-0.5 |
-0.5 |
-0.6 |
-0.4 |
8 |
-0.0 |
-0.5 |
-0.4 |
-0.3 |
-0.2 |
+0.1 |
-0.2 |
9 |
-0.2 |
-0.6 |
-0.6 |
-0.4 |
-0.5 |
-0.2 |
-0.4 |
10 |
-0.2 |
-0.5 |
-0.7 |
-0.5 |
-0.9 |
-0.3 |
-0.5 |
11 |
-0.2 |
-0.8 |
-0.9 |
-0.9 |
-1.0 |
-0.5 |
-0.7 |
12 |
-0.3 |
-1.1 |
-1.0 |
-1.3 |
-1.3 |
-0.9 |
-1.0 |
13 |
-0.7 |
-0.9 |
-1.3 |
-1.4 |
-1.5 |
-1.1 |
-1.1 |
14 |
-0.8 |
-0.9 |
-1.5 |
-1.5 |
-1.5 |
-1.3 |
-1.2 |
15 |
-1.0 |
-0.8 |
-1.3 |
-1.6 |
-1.6 |
-1.5 |
-1.3 |
16 |
-1.1 |
-1.2 |
-1.5 |
-1.6 |
-1.7 |
-1.6 |
-1.4 |
17 |
-1.4 |
-1.7 |
-1.7 |
-1.8 |
-1.8 |
-1.8 |
-1.7 |
18 |
-1.5 |
-1.9 |
-1.9 |
-1.9 |
-1.8 |
-1.7 |
-1.8 |
19 |
-1.5 |
-1.9 |
-1.9 |
-1.9 |
-1.6 |
-1.7 |
-1.7 |
20 |
-1.4 |
-2.0 |
-1.8 |
-1.8 |
-1.6 |
-1.7 |
-1.7 |
21 |
-1.5 |
-2.1 |
-1.8 |
-1.8 |
-1.6 |
-1.6 |
-1.7 |
22 |
-1.6 |
-2.1 |
-1.9 |
-1.9 |
-1.6 |
-1.7 |
-1.8 |
23 |
-1.6 |
-2.1 |
-1.9 |
-1.9 |
-1.7 |
-1.7 |
-1.8 |
Mean |
-1.0 |
-1.4 |
-1.4 |
-1.5 |
-1.4 |
-1.3 |
-1.3 |
Table 4: Temperature differences by hour and wind speed
This is the hourly average temperature and wind speed logged as the difference of the VP2 from the La Crosse by month for the 6 months between October 2018 and March 2019. A positive difference is when the VP2 is higher than the old equipment and conversely for the negative differences.
Davis Out Ta Delta from La Crosse WS 2306 by hour and wind speed |
|||||||||||||||||||||||||
|
Hour |
||||||||||||||||||||||||
Wind Speed |
0 |
1 |
2 |
3 |
4 |
5 |
6 |
7 |
8 |
9 |
10 |
11 |
12 |
13 |
14 |
15 |
16 |
17 |
18 |
19 |
20 |
21 |
22 |
23 |
Mean |
0 |
-2.1 |
-2.1 |
-2.0 |
-2.0 |
-1.9 |
-1.8 |
-1.4 |
-0.7 |
-0.3 |
-0.9 |
-0.1 |
-0.3 |
-0.4 |
-0.9 |
-1.1 |
-1.8 |
-1.8 |
-1.5 |
-1.8 |
-1.9 |
-2.0 |
-2.2 |
-2.2 |
-2.1 |
-1.9 |
1 |
-1.8 |
-1.8 |
-1.6 |
-1.5 |
-1.6 |
-1.3 |
-1.1 |
-0.8 |
-0.3 |
-0.2 |
-0.7 |
-0.4 |
|
-0.7 |
-0.6 |
-2.1 |
-1.3 |
-1.4 |
-1.7 |
-1.9 |
-2.0 |
-1.9 |
-1.8 |
-1.8 |
-1.5 |
2 |
-1.4 |
-1.5 |
-1.4 |
-1.3 |
-1.3 |
-1.2 |
-0.8 |
-0.3 |
-0.1 |
-0.3 |
-0.2 |
-0.3 |
-0.4 |
-0.9 |
-0.8 |
-1.3 |
-1.1 |
-1.6 |
-1.7 |
-1.6 |
-1.7 |
-1.8 |
-1.8 |
-1.7 |
-1.1 |
3 |
-1.5 |
-1.5 |
-1.5 |
-1.4 |
-1.3 |
-1.2 |
-0.8 |
-0.4 |
-0.2 |
-0.3 |
-0.4 |
-0.4 |
-0.7 |
-0.9 |
-1.2 |
-1.3 |
-1.2 |
-1.6 |
-1.8 |
-1.9 |
-1.7 |
-1.6 |
-1.5 |
-1.4 |
-1.1 |
4 |
-1.4 |
-1.4 |
-1.3 |
-1.1 |
-1.0 |
-1.0 |
-0.8 |
-0.4 |
-0.2 |
-0.4 |
-0.5 |
-0.4 |
-0.7 |
-0.8 |
-1.0 |
-1.1 |
-1.1 |
-1.7 |
-1.9 |
-1.8 |
-1.7 |
-1.6 |
-1.6 |
-1.6 |
-1.1 |
5 |
-1.3 |
-1.2 |
-1.2 |
-1.2 |
-1.0 |
-1.0 |
-0.6 |
-0.3 |
-0.3 |
-0.5 |
-0.5 |
-1.0 |
-0.9 |
-0.9 |
-1.0 |
-1.2 |
-1.2 |
-1.7 |
-2.0 |
-1.7 |
-1.5 |
-1.5 |
-1.5 |
-1.4 |
-1.2 |
6 |
-1.1 |
-1.0 |
-1.1 |
-0.7 |
-0.6 |
-0.9 |
-0.7 |
-0.2 |
-0.2 |
-0.5 |
-0.5 |
-0.7 |
-1.0 |
-1.0 |
-1.1 |
-1.1 |
-1.4 |
-1.7 |
-1.8 |
-1.6 |
-1.5 |
-1.4 |
-1.4 |
-1.2 |
-1.0 |
7 |
-1.0 |
-0.9 |
-1.1 |
-0.8 |
-0.7 |
-0.8 |
-0.4 |
-0.4 |
-0.2 |
-0.5 |
-0.6 |
-0.7 |
-1.1 |
-1.2 |
-1.3 |
-1.4 |
-1.6 |
-1.7 |
-1.7 |
-1.7 |
-1.6 |
-1.4 |
-1.1 |
-1.0 |
-1.1 |
8 |
-1.0 |
-1.0 |
-1.2 |
-0.9 |
-0.8 |
-1.1 |
-0.4 |
-0.3 |
-0.2 |
-0.5 |
-0.7 |
-0.8 |
-1.0 |
-1.2 |
-1.2 |
-1.4 |
-1.5 |
-1.7 |
-1.7 |
-1.5 |
-1.5 |
-1.4 |
-1.2 |
-0.9 |
-1.1 |
9 |
-0.9 |
-1.0 |
-1.0 |
-0.7 |
-0.8 |
-1.1 |
-0.4 |
-0.2 |
-0.3 |
-0.4 |
-0.6 |
-1.0 |
-1.3 |
-1.6 |
-1.6 |
-1.6 |
-1.7 |
-1.8 |
-1.7 |
-1.6 |
-1.6 |
-1.4 |
-1.1 |
-1.1 |
-1.3 |
10 |
-0.7 |
-0.9 |
-0.6 |
-0.7 |
-1.0 |
-0.9 |
-0.5 |
-0.3 |
-0.2 |
-0.5 |
-0.5 |
-0.9 |
-1.2 |
-1.3 |
-1.5 |
-1.4 |
-1.6 |
-1.8 |
-1.8 |
-1.5 |
-1.5 |
-1.4 |
-1.0 |
-0.9 |
-1.2 |
11 |
-0.8 |
-1.0 |
-0.7 |
-0.4 |
-0.6 |
-0.8 |
-0.5 |
-0.1 |
-0.2 |
0.1 |
-0.7 |
-0.8 |
-1.2 |
-1.3 |
-1.7 |
-1.3 |
-1.7 |
-1.8 |
-1.7 |
-1.5 |
-1.5 |
-1.1 |
-0.9 |
-0.8 |
-1.2 |
12 |
-0.7 |
-0.5 |
-1.0 |
-0.4 |
-0.5 |
-0.5 |
-0.5 |
-0.5 |
-0.4 |
-0.3 |
-0.5 |
-0.8 |
-0.9 |
-1.2 |
-1.1 |
-1.3 |
-1.4 |
-1.7 |
-1.9 |
-1.5 |
-1.4 |
-1.0 |
0.0 |
-1.2 |
-1.1 |
13 |
-0.9 |
-0.8 |
-0.7 |
-0.6 |
|
-1.1 |
-1.2 |
-0.3 |
-0.3 |
-0.2 |
-0.4 |
-0.8 |
-0.9 |
-1.1 |
-1.3 |
-1.2 |
-1.5 |
-1.8 |
-1.9 |
-1.5 |
-1.1 |
-1.0 |
-1.0 |
-0.8 |
-1.1 |
14 |
-0.8 |
-0.7 |
-0.6 |
-0.6 |
-0.6 |
|
-1.2 |
-0.4 |
-0.1 |
-0.4 |
-0.3 |
-0.7 |
-1.0 |
-1.1 |
-1.1 |
-1.0 |
-1.4 |
-1.7 |
-1.6 |
-1.7 |
-1.0 |
-1.0 |
-0.9 |
-0.8 |
-1.1 |
15 |
-0.7 |
-0.7 |
|
|
|
|
|
-0.1 |
-0.6 |
-0.3 |
-0.7 |
-1.0 |
-0.7 |
-0.7 |
-0.9 |
-0.2 |
-1.0 |
-1.3 |
-1.6 |
-1.7 |
-1.2 |
-1.0 |
-0.8 |
-0.9 |
-0.8 |
16 |
-1.1 |
-1.3 |
-0.7 |
-0.7 |
-0.6 |
|
|
-0.7 |
-0.8 |
-0.3 |
-0.5 |
-0.2 |
-1.3 |
-1.3 |
-1.6 |
-0.6 |
-1.2 |
-1.7 |
-1.3 |
-1.6 |
-0.7 |
-1.0 |
|
-0.9 |
-1.0 |
17 |
|
|
-0.7 |
-0.5 |
|
|
|
-0.1 |
-0.7 |
-0.8 |
-1.0 |
-0.1 |
-0.6 |
-0.7 |
-0.5 |
-0.5 |
-1.2 |
-1.5 |
-1.4 |
-2.0 |
-0.9 |
-0.9 |
-0.9 |
|
-0.9 |
18 |
-0.9 |
|
-0.8 |
-0.6 |
|
|
|
|
0.1 |
-0.6 |
-0.1 |
0.1 |
-0.3 |
-0.6 |
-0.4 |
0.0 |
-0.5 |
-0.5 |
-0.9 |
-1.8 |
|
|
|
|
-0.4 |
19 |
|
-0.7 |
-0.7 |
|
|
|
|
|
0.1 |
-0.9 |
-0.1 |
-1.1 |
-0.7 |
-1.3 |
-0.5 |
-0.2 |
-0.9 |
-0.4 |
-2.9 |
|
|
|
-0.8 |
|
-0.5 |
20 |
|
|
|
|
|
|
|
|
|
|
-0.9 |
-1.2 |
-1.2 |
-0.6 |
-0.1 |
-0.9 |
-0.9 |
-1.5 |
|
|
|
|
|
|
-0.9 |
21 |
|
|
|
|
|
|
|
|
|
-1.2 |
-0.4 |
-0.3 |
-0.1 |
+0.5 |
+0.1 |
+1.0 |
|
-0.3 |
|
-2.6 |
|
|
|
|
-0.2 |
22 |
|
|
|
|
|
|
|
|
|
-1.0 |
|
-1.2 |
-1.1 |
|
|
-1.0 |
-2.1 |
-3.0 |
|
-3.1 |
|
|
|
|
-1.7 |
23 |
|
|
|
|
|
|
|
|
|
|
|
+1.2 |
+0.9 |
+1.9 |
|
+0.5 |
+0.5 |
-1.2 |
|
-3.1 |
|
|
|
|
-0.1 |
24 |
|
|
|
|
|
|
|
|
|
|
|
|
|
+2.0 |
+1.1 |
+0.8 |
+0.7 |
|
|
-3.7 |
|
|
|
|
-0.3 |
25 |
|
|
|
|
|
|
|
|
|
|
|
|
+0.5 |
|
|
+0.8 |
-4.8 |
-2.8 |
|
|
|
|
|
|
-1.4 |
26 |
|
|
|
|
|
|
|
|
|
|
|
+1.4 |
|
+1.9 |
+1.3 |
|
-1.7 |
|
|
|
|
|
|
|
0.2 |
27 |
|
|
|
|
|
|
|
|
|
|
|
|
-3.6 |
+1.9 |
+1.4 |
+0.9 |
|
|
|
|
|
|
|
|
0.9 |
28 |
|
|
|
|
|
|
|
|
|
|
|
|
|
|
|
|
-4.0 |
|
|
|
|
|
|
|
-4.0 |
29 |
|
|
|
|
|
|
|
|
|
|
|
|
-8.0 |
|
+1.1 |
|
|
|
|
|
|
|
|
|
-3.5 |
31 |
|
|
|
|
|
|
|
|
|
|
|
|
|
|
+1.2 |
|
|
|
|
|
|
|
|
|
1.2 |
32 |
|
|
|
|
|
|
|
|
|
|
|
|
|
|
+0.6 |
|
|
|
|
|
|
|
|
|
0.6 |
Mean |
-1.8 |
-1.8 |
-1.8 |
-1.7 |
-1.7 |
-1.5 |
-1.0 |
-0.4 |
-0.2 |
-0.4 |
-0.5 |
-0.7 |
-1.0 |
-1.1 |
-1.2 |
-1.3 |
-1.4 |
-1.7 |
-1.8 |
-1.7 |
-1.7 |
-1.7 |
-1.8 |
-1.8 |
-1.3 |
Table 5: Humidity comparison
This compares the humidity parameters of relative humidity (RH) and dew point (DP) during the 13 month comparison period. Positive difference show the VP2 was higher than the old sensor. Daily data is measured over a 24 hour period from 12am.
Humidity averages and extremes comparison |
||||||||||||||||||
Month |
Mean Min RH Old |
Mean Min RH VP2 |
Mean Min RH VP2 delta from Old |
Mean Max RH Old |
Mean Max RH VP2 |
Mean Max RH VP2 delta from Old |
Mean RH Old |
Mean RH VP2 |
Mean RH New Delta from Old |
Mean DP Old |
Mean DP VP2 |
Mean DP New Delta from Old |
Min DP Old |
Min DP VP2 |
Min DP New Delta from Old |
Max DP Old |
Max DP VP2 |
Max DP New Delta from Old |
2018 |
|
|
|
|
|
|
|
|
|
|
|
|
|
|
|
|
|
|
Oct |
61.0 |
55.9 |
-5.1 |
96.8 |
95.9 |
-1.0 |
78.9 |
75.9 |
-3.0 |
17.0 |
16.4 |
-0.6 |
14.8 |
14.1 |
-0.6 |
19.2 |
18.7 |
-0.5 |
Nov |
42.6 |
38.6 |
-4.0 |
85.8 |
86.1 |
+0.3 |
64.2 |
62.3 |
-1.9 |
15.8 |
14.6 |
-1.0 |
3.5 |
-2.8 |
-1.3 |
25.6 |
25.2 |
-0.7 |
Dec |
50.7 |
47.2 |
-3.5 |
91.0 |
88.8 |
-2.2 |
70.8 |
68.0 |
-2.8 |
18.9 |
17.9 |
-1.0 |
12.1 |
3.8 |
-1.0 |
25.4 |
24.8 |
-0.9 |
2019 |
|
|
|
|
|
|
|
|
|
|
|
|
|
|
|
|
|
|
Jan |
47.5 |
44.2 |
-3.3 |
87.8 |
87.6 |
-0.2 |
67.6 |
65.9 |
-1.7 |
20.0 |
18.9 |
-1.2 |
15.8 |
10.3 |
-1.4 |
23.4 |
22.4 |
-1.0 |
Feb |
48.7 |
44.8 |
-3.9 |
88.1 |
84.0 |
-4.2 |
68.4 |
64.4 |
-4.1 |
19.5 |
18.3 |
-1.3 |
12.5 |
10.4 |
-1.4 |
26.4 |
25.3 |
-1.2 |
Mar |
55.1 |
48.6 |
-7.4 |
94.8 |
92.8 |
-1.9 |
74.9 |
70.7 |
-4.7 |
20.7 |
19.4 |
-1.3 |
8.2 |
0.5 |
-1.5 |
25 |
24.6 |
-0.5 |
Apr |
58.6 |
54.4 |
-4.0 |
94.2 |
93.5 |
-0.8 |
76.4 |
73.9 |
-2.4 |
17.1 |
16.4 |
-0.5 |
11.7 |
8.6 |
-0.6 |
22.4 |
22.5 |
-0.5 |
May |
49.7 |
45.7 |
-4.0 |
90.7 |
89.6 |
-1.1 |
70.2 |
67.6 |
-2.5 |
13.3 |
12.0 |
-0.7 |
-2.7 |
-11.1 |
-1.0 |
20.9 |
21.2 |
-0.5 |
Jun |
47.4 |
47.5 |
+0.1 |
92.2 |
90.5 |
-2.0 |
70.1 |
69.0 |
-1.2 |
11.4 |
10.7 |
+1.3 |
1.2 |
-3.2 |
-1.3 |
20.2 |
19.3 |
-0.9 |
Jul |
46.3 |
39.9 |
-6.4 |
87.8 |
88.3 |
0.0 |
66.8 |
64.1 |
-2.9 |
10.2 |
8.9 |
-1.1 |
-0.8 |
-6.8 |
-1.5 |
17.4 |
18.2 |
-0.7 |
Aug |
38.4 |
318 |
-6.5 |
83.4 |
84.1 |
+0.7 |
60.9 |
58 |
-2.9 |
9.1 |
7.1 |
-1.8 |
0.1 |
123.2 |
-2.7 |
16.9 |
18.1 |
-0.5 |
Sep |
36.0 |
26.5 |
-9.5 |
81.9 |
82.1 |
+0.2 |
59.0 |
54.3 |
-4.7 |
11.3 |
8.1 |
-2.5 |
-3.6 |
-11.6 |
-3.2 |
18.6 |
18.6 |
-0.8 |
Oct |
46.2 |
39.6 |
-6.8 |
89.6 |
87.7 |
-2.2 |
67.9 |
63.7 |
-4.5 |
15.0 |
13.2 |
-1.3 |
8.2 |
3.2 |
-1.5 |
22.7 |
22.4 |
-1.0 |
Mean |
48.2 |
43.4 |
-4.9 |
89.5 |
88.5 |
-1.1 |
68.9 |
65.9 |
-3.0 |
16.4 |
14.0 |
-1.1 |
-3.6 |
-13.2 |
-1.4 |
26.4 |
25.3 |
-0.7 |
Table 6: MSL pressure comparison
This compares the monthly MSL pressure data compared to the La Crosse sensor over the 13 month comparison period. Data is shown to 2 decimal places in order to compare the data whilst the accuracy of the sensors is much lower than this. Positive difference show the VP2 was higher than the old sensor. Daily data is measured over a 24 hour period from 12am.
MSL Pressure averages comparison |
|||
Month |
Mean daily MSLP old (hPa) |
Mean daily MSLP VP2 (hPa) |
Mean daily MSLP Delta from Old (hPa) |
2018 |
|
|
|
Oct |
1016.18 |
1016.59 |
+0.41 |
Nov |
1012.56 |
1012.84 |
+0.28 |
Dec |
1013.32 |
1013.59 |
+0.27 |
2019 |
|
|
|
Jan |
1014.67 |
1014.89 |
+0.21 |
Feb |
1012.20 |
1012.38 |
+0.18 |
Mar |
1014.25 |
1014.68 |
+0.43 |
Apr |
1020.46 |
1020.87 |
+0.34 |
May |
1020.91 |
1021.09 |
+0.17 |
Jun |
1021.81 |
1021.99 |
+0.19 |
Jul |
1021.17 |
1021.30 |
+0.20 |
Aug |
1019.73 |
1020.04 |
+0.30 |
Sep |
1019.44 |
1019.76 |
+0.31 |
Oct |
1017.99 |
1018.50 |
+0.51 |
Average |
1017.28 |
1017.61 |
+0.29 |
Table 7: MSL pressure calibration comparison
This compares the monthly means for daily average, minimum and maximum MSL pressure data with the Bureau of Meteorology Brisbane site to check the calibration over the comparison period. Data is shown to 2 decimal places in order to compare the data whilst the accuracy of the sensors is much lower than this. Positive difference show the VP2 was higher than the Brisbane site.
Monthly mean MSL pressure compared to Bureau of Meteorology Brisbane site (040913) |
||||
Month |
Diff. of Average |
Diff. of Max |
Diff. of Min |
Average of Daily Average MSLP |
2018 |
-0.04 |
-3.23 |
+0.34 |
1013.69 |
Oct |
-0.01 |
-0.70 |
+0.66 |
1014.22 |
Nov |
+0.13 |
+0.01 |
+0.23 |
1011.40 |
Dec |
+0.13 |
+0.15 |
+0.11 |
1015.44 |
2019 |
0.00 |
-0.04 |
+0.04 |
1016.32 |
Jan |
+0.13 |
+0.31 |
+0.14 |
1017.16 |
Feb |
+0.15 |
+0.15 |
+0.19 |
1017.86 |
Mar |
+0.01 |
-0.03 |
-0.18 |
1017.16 |
Apr |
+0.03 |
+0.05 |
+0.07 |
1020.07 |
May |
-0.06 |
-0.14 |
+0.01 |
1018.58 |
Jun |
-0.06 |
-0.12 |
-0.01 |
1018.76 |
Jul |
-0.10 |
-0.20 |
+0.01 |
1015.20 |
Aug |
-0.12 |
-0.32 |
+0.08 |
1013.39 |
Sep |
-0.01 |
-0.09 |
+0.08 |
1013.92 |
Oct |
+0.03 |
+0.03 |
+0.02 |
1011.55 |
Mean |
-0.02 |
-1.80 |
-1.51 |
1015.75 |
Table 8: Rainfall comparison
This compares the monthly rainfall totals and highest daily totals over the 13 month period for the Davis TBRG compared to the La Crosse TBRG and the standard check gauge (SRG). The meteorological day is the 24 hours to 12am for the La Crosse gauge and the 24 hours to 9am for the Davis TBGR and the standard check gauge.
Monthly rainfall totals and monthly wettest day comparison |
||||||||||
Month |
Total Rainfall La Crosse (TBRG) |
Total Rainfall VP2 (TBRG) |
Check gauge total (SRG) |
Total Rainfall VP2 (TBRG) % from La Crosse |
Total Rainfall VP2 (TBRG) % from check gauge |
Highest Daily Rainfall La Crosse (TBRG) |
Highest Daily Rainfall New (TBRG) |
Highest Daily Check gauge total (SRG) |
Total Rainfall VP2 delta of La Crosse (TBRG) |
Total Rainfall VP2 (TBRG) delta of Check gauge |
2018 |
|
|
|
|
|
|
|
|
|
|
Oct |
241.1 |
238 |
253.5 |
-1.3% |
-6.2% |
37.8 |
40.6 |
55.3 |
-3.1 |
-15.5 |
Nov |
17.5 |
17.6 |
20.9 |
+0.6% |
-15.8% |
9.8 |
9.6 |
10.9 |
+0.1 |
-3.3 |
Dec |
58.5 |
62.6 |
80.6 |
+7.0% |
-22.8% |
32.6 |
36.6 |
36.1 |
+4.1 |
-18 |
2019 |
|
|
|
|
|
|
|
|
|
|
Jan |
6.6 |
8.4 |
10.8 |
+27.3% |
-22.2% |
3.6 |
3.2 |
4.4 |
+1.8 |
-2.4 |
Feb |
40.4 |
36.4 |
47.2 |
-9.9% |
-22.9% |
22.8 |
19.2 |
24.2 |
-4 |
-10.8 |
Mar |
204.1 |
201.8 |
229 |
-1.1% |
-11.6% |
66.8 |
59.6 |
75.6 |
-2.3 |
-27.2 |
Apr |
80.8 |
81 |
79.6 |
+0.2% |
-10.6% |
34.7 |
34.8 |
35.3 |
+0.2 |
+1.4 |
May |
30.8 |
31.6 |
43.9 |
+2.6% |
-15.3% |
10.3 |
11.2 |
9.2 |
+0.8 |
-12.3 |
Jun |
32.1 |
33 |
38 |
+2.8% |
-12.6% |
9.9 |
11.4 |
12 |
+0.9 |
-5 |
Jul |
16.1 |
16.2 |
20.7 |
+0.6% |
-22.7% |
10.9 |
10.6 |
11.5 |
+0.1 |
-4.5 |
Aug |
9.8 |
10.6 |
11.8 |
+8.2% |
+6.8% |
8.8 |
10 |
10.5 |
+0.8 |
-1.2 |
Sep |
1.5 |
1.8 |
2.8 |
+20.0% |
-35.7% |
1.5 |
1.8 |
2 |
+0.3 |
-1 |
Oct |
40.9 |
44.4 |
48.1 |
+8.6% |
-39.3% |
11.4 |
15.2 |
26.7 |
+3.5 |
-3.7 |
Average |
780.2 |
783.4 |
886.9 |
+0.4% |
-13.6% |
66.8 |
59.6 |
75.6 |
+3.2 |
-103.5 |
Table 9: Rainfall by wind speed
This shows the difference of rainfall since midnight for the Davis TBRG vs the La Crosse TBGR by grouped wind speed from the logged 5 minute interval observations between 4 October 2018 and 31 March 2019.
Rainfall since midnight by recent high wind gust |
|
Davis Recent High Wind Gust (km/hr) |
Average of VP2 Rain Today Delta from La Crosse (mm) |
0-5 |
-19% |
5-10 |
-10% |
10-15 |
-12% |
15-20 |
-10% |
20-25 |
-15% |
25-30 |
-8% |
30-35 |
+22% |
35-40 |
+24% |
40-45 |
+8% |
45-50 |
+44% |
50-55 |
+53% |
Mean |
-12% |
Table 10: Rainfall by rainfall intensity (compared to check gauge)
This compares the daily rainfall totals between the VP2 TBRG and the check gauge aggregated by average rainfall by grouped daily maximum rainfall intensity (mm/hr). The meteorological day used for this comparison is the 24 hours to 9am.
Rainfall compared to the check gauge by rainfall intensity |
||||
Rain Intensity group (mm/hr) |
Member count of grouping |
Average of Rainfall VP2 (TBRG) 9am |
Average of Check gauge total (SRG) |
Difference of daily VP2 Rainfall (9am) from check gauge (9am) total |
0-10 |
298 |
0.9 |
1.1 |
-0.1 |
10-20 |
6 |
1.2 |
1.5 |
-0.3 |
20-30 |
9 |
4.4 |
4.9 |
-0.5 |
30-40 |
6 |
3.4 |
4.0 |
-0.6 |
40-50 |
4 |
7.1 |
8.6 |
-1.5 |
50-60 |
2 |
13.6 |
18.1 |
-4.5 |
60-70 |
5 |
9.6 |
10.7 |
-1.1 |
70-80 |
2 |
7.1 |
11.0 |
-3.9 |
80-90 |
3 |
0.7 |
1.1 |
-0.4 |
90-100 |
3 |
12.9 |
13.8 |
-1.0 |
>100 |
14 |
16.8 |
18.5 |
-1.7 |
Grand Total |
352 |
2.1 |
2.4 |
-0.3 |
Table 11: Rainfall by rainfall intensity (compared to TBGR)
This compares the daily rainfall totals between the VP2 TBRG and the La Crosse aggregated by average rainfall by grouped daily maximum rainfall intensity (mm/hr). The meteorological days used for this comparison is the 24 hours from 12am.
Rainfall compared to the La Crosse TBGR by rainfall intensity |
||||
Rain Intensity group |
Member count of grouping |
Average of Rainfall La Crosse (TBRG) |
Average of Rainfall VP2 (TBRG) 9am |
Difference of daily VP2 Rainfall (12am) from La Crosse (12am) total |
0-10 |
298 |
0.4 |
0.9 |
-0.6 |
10-20 |
6 |
1.9 |
1.2 |
+0.7 |
20-30 |
9 |
5.8 |
4.4 |
+1.4 |
30-40 |
6 |
4.2 |
3.4 |
+0.8 |
40-50 |
4 |
9.3 |
7.1 |
+2.2 |
50-60 |
2 |
6.0 |
13.6 |
-7.6 |
60-70 |
5 |
11.7 |
9.6 |
+2.1 |
70-80 |
2 |
5.2 |
7.1 |
-1.9 |
80-90 |
3 |
6.8 |
0.7 |
+6.0 |
90-100 |
3 |
7.3 |
12.9 |
-5.6 |
>100 |
14 |
27.6 |
16.8 |
+10.8 |
Mean |
352 |
2.1 |
2.1 |
+0.1 |
Table 12: Rainfall by daily mean temperature
Comparison of the difference of Davis Vantage Pro 2 daily rainfall compared to check gauge by grouped mean daily temperature. The meteorological days used for this comparison is the 24 hours from 9am for rainfall.
Average rainfall from check gauge by mean daily temperature |
|
Mean Daily temperature group (C) |
Average of Rainfall VP2 (TBRG) % Difference from Check gauge |
14.5-15.5 |
-41% |
15.5-16.5 |
-64% |
16.5-17.5 |
-51% |
17.5-18.5 |
-59% |
18.5-19.5 |
-74% |
19.5-20.5 |
-52% |
20.5-21.5 |
-19% |
21.5-22.5 |
-39% |
22.5-23.5 |
-46% |
23.5-24.5 |
-37% |
24.5-25.5 |
-26% |
25.5-26.5 |
-40% |
26.5-27.5 |
-48% |
27.5-28.5 |
-63% |
28.5-29.5 |
-13% |
30.5-31.5 |
-60% |
Mean |
-46% |
Table 13: Daily rainfall comparisons
This compares the VP2 rainfall by daily rainfall totals to the check gauge and the La Crosse TBRG over the 13 month comparison period.
Daily rainfall totals comparison by VP2 TBRG rainfall amounts |
||||||||||||
Rain total |
Rainfall La Crosse (TBRG) |
Rainfall VP2 (TBRG) 9am |
Rainfall VP2 12am (TBRG) |
Check gauge total (SRG) |
Rainfall VP2 (TBRG) Rain days |
Rainfall La Crosse (TBRG) Rain days |
Rainfall Check gauge Rain days |
Mean Rainfall La Crosse (TBRG) |
Mean Rainfall VP2 (TBRG) |
Mean Check gauge total (SRG) |
Total Rainfall VP2 (TBRG) % from check gauge |
Total Rainfall VP2 (TBRG) % from La Crosse |
0 - 0.8 |
10.2 |
77.0 |
16.2 |
96.5 |
43 |
15 |
34 |
0.2 |
0.4 |
2.2 |
-20% |
+59% |
1 - 1.8 |
21.3 |
52.2 |
24.0 |
69.3 |
17 |
17 |
12 |
1.3 |
1.4 |
4.1 |
-25% |
13% |
2 - 2.8 |
28.4 |
58.8 |
26.8 |
67.0 |
11 |
11 |
10 |
2.6 |
2.4 |
6.1 |
-12% |
-6% |
3 - 3.8 |
18.6 |
15.4 |
17.2 |
19.0 |
5 |
5 |
5 |
3.7 |
3.4 |
3.8 |
-19% |
-8% |
4 - 4.8 |
34.2 |
12.0 |
34.8 |
14.2 |
8 |
8 |
5 |
4.3 |
4.4 |
1.8 |
-15% |
2% |
5 - 9.8 |
84.9 |
104.4 |
82.0 |
121.3 |
11 |
11 |
9 |
7.7 |
7.5 |
11.0 |
-14% |
-3% |
10 - 14.8 |
97.9 |
56.4 |
100.6 |
57.5 |
9 |
9 |
6 |
10.9 |
11.2 |
6.4 |
-2% |
3% |
15 - 19.8 |
92.3 |
41.2 |
88.8 |
48.3 |
5 |
5 |
4 |
18.5 |
17.8 |
9.7 |
-15% |
-4% |
20 - 29.8 |
49.8 |
15.8 |
51.2 |
16.7 |
2 |
2 |
1 |
24.9 |
25.6 |
8.4 |
-5% |
+3% |
30 - 39.8 |
132.1 |
64.8 |
135.4 |
73.6 |
4 |
4 |
4 |
33.0 |
33.9 |
18.4 |
-12% |
+2% |
40 to 60 |
192.1 |
172.2 |
192.2 |
186.9 |
4 |
4 |
4 |
48.0 |
48.1 |
46.7 |
-8% |
+0% |
Total |
761.8 |
670.2 |
769.2 |
770.3 |
119 |
91 |
94 |
6.5 |
6.5 |
6.5 |
-13% |
+1% |
Table 14: Rain and wet days comparison
This compares the monthly rainfall totals frequency of rain days (of at least 0.1 mm for the check gauge, 0.2 mm for the VP2 and 0.5 mm for the La Crosse) and wet days (of at least 1mm) for the three rain gauges over the 13 month comparison period.
Monthly totals, rain days and wet days comparison |
|||||||||
Month |
Total Rainfall Old (TBRG) |
Total Rainfall VP2 (TBRG) |
Check gauge total (SRG) |
Rainfall Old (TBRG) Rain days |
Rainfall VP2 (TBRG) Rain days |
Rainfall Check gauge (TBRG) Rain days |
Rainfall Old (TBRG) Wet days |
Rainfall VP2 (TBRG) Wet days |
Rainfall Check gauge (TBRG) Wet days |
2018 |
|
|
|
|
|
|
|
|
|
Oct |
241.1 |
237.8 |
253.5 |
16 |
18 |
17 |
14 |
18 |
17 |
Nov |
17.5 |
17.6 |
20.9 |
5 |
5 |
6 |
4 |
5 |
6 |
Dec |
58.5 |
62.2 |
80.6 |
7 |
11 |
14 |
7 |
11 |
14 |
2019 |
|
|
|
|
|
|
|
|
|
Jan |
6.6 |
8.4 |
10.8 |
4 |
6 |
9 |
3 |
6 |
9 |
Feb |
40.4 |
36.4 |
47.2 |
7 |
10 |
13 |
7 |
10 |
13 |
Mar |
204.1 |
202.4 |
229 |
13 |
16 |
18 |
10 |
16 |
18 |
Apr |
80.8 |
71.2 |
79.6 |
14 |
14 |
17 |
11 |
14 |
17 |
May |
30.8 |
37.2 |
43.9 |
12 |
12 |
12 |
6 |
12 |
18 |
Jun |
32.1 |
33.2 |
38 |
10 |
13 |
12 |
8 |
13 |
18 |
Jul |
16.1 |
16 |
20.7 |
4 |
5 |
10 |
3 |
5 |
15 |
Aug |
9.8 |
12.6 |
11.8 |
3 |
3 |
4 |
1 |
3 |
9 |
Sep |
1.5 |
1.8 |
2.8 |
1 |
1 |
3 |
1 |
1 |
7 |
Oct |
40.9 |
29.2 |
48.1 |
7 |
7 |
8 |
6 |
7 |
10 |
Average |
780.2 |
766 |
886.9 |
103 |
121 |
143 |
81 |
121 |
171 |
Table 15: check gauge relocation comparison
This outlines the on-going comparison between the check gauge at the old location and the new relocated check gauge adjacent to the VP2 for the period between April 2018 and October 2019.
Check gauge relocation comparison |
|||
Row Labels |
Total of Nylex (check gauge) |
Total of Nylex relocated gauge |
Difference of Nylex test gauge (%) |
2018 |
554.1 |
533.1 |
-3.7 |
Apr |
40.2 |
22.6 |
|
May |
46.9 |
45.1 |
-3.8 |
Jun |
25.9 |
26.6 |
+2.7 |
Jul |
20.9 |
19.1 |
-8.6 |
Aug |
17.1 |
16.6 |
-2.9 |
Sep |
37.9 |
37.3 |
-1.6 |
Oct |
2-63.5 |
264.3 |
+0.3 |
Nov |
21.6 |
20.9 |
-3.2 |
Dec |
80.1 |
80.6 |
+0.6 |
2019 |
516.5 |
536.3 |
+3.8 |
Jan |
11 |
10.6 |
-3.6 |
Feb |
39.8 |
47.2 |
+18.6 |
Mar |
236.9 |
229 |
-3.3 |
Apr |
64.9 |
79.6 |
+22.7 |
May |
36.1 |
38.8 |
+7.5 |
Jun |
35.9 |
38 |
+5.8 |
Jul |
17.6 |
20.7 |
+17.6 |
Aug |
11.8 |
11.4 |
-3.4 |
Sep |
2.8 |
2.3 |
-17.9 |
Oct |
48.5 |
47.8 |
-1.4 |
Total |
1059.4 |
1058.5 |
-2.7 |
Table 16 and 17: Wind speed comparisons
This shows the monthly mean wind speed, mean highest daily wind speed, mean highest daily wind gust, monthly total wind run, and monthly highest wind gust for the two anemometers during the 13 month comparison period. The meteorological days used for this comparison is the 24 hours from 12am.
Wind speed averages comparison |
||||||||||||
Month |
Mean Wind Speed La Crosse |
Mean Wind Speed VP2 |
Mean Wind Speed VP2 % Diff from La Crosse |
Mean Wind Speed New Delta from La Crosse |
Mean Highest Wind Speed La Crosse |
Mean Highest Wind Speed VP2 |
Mean Highest Wind Speed VP2 Delta from La Crosse |
Mean Highest Wind Speed VP2 % Diff from La Crosse |
Mean Highest Wind Gust La Crosse |
Mean Highest Wind Gust VP2 |
Highest Wind Gust Vp2 Delta from La Crosse |
Mean Highest Wind Gust VP2 % from La Crosse |
2018 |
|
|
|
|
|
|
|
|
|
|
|
|
Oct |
2.1 |
2.5 |
+17.1% |
+0.4 |
16.8 |
9.6 |
-7.3 |
-43.1% |
27.7 |
25.3 |
-2.3 |
-8.5% |
Nov |
3.1 |
4.9 |
+56.3% |
+1.8 |
21.0 |
14.4 |
-6.6 |
-31.5% |
35.8 |
28.3 |
-7.4 |
-20.8% |
Dec |
3.7 |
5.5 |
+48.2% |
+1.8 |
23.3 |
14.7 |
-8.7 |
-37.1% |
35.7 |
28.7 |
-7.0 |
-19.6% |
2019 |
|
|
|
|
|
|
|
|
|
|
|
|
Jan |
2.9 |
4.9 |
+67.8% |
+2.0 |
19.8 |
13.6 |
-6.2 |
-31.3% |
34.1 |
26.7 |
-7.3 |
-21.5% |
Feb |
5.1 |
6.0 |
+19.1% |
+1.0 |
24.8 |
14.6 |
-10.2 |
-41.0% |
37.5 |
29.9 |
-7.7 |
-20.4% |
Mar |
2.5 |
4.3 |
+73.3% |
+1.8 |
17.2 |
13.2 |
-4.0 |
-23.2% |
31.2 |
26.8 |
-4.3 |
-13.9% |
Apr |
--- |
--- |
--- |
--- |
--- |
11.7 |
--- |
--- |
32.7 |
24.6 |
-8.0 |
-24.6% |
May |
--- |
--- |
--- |
--- |
--- |
11.6 |
--- |
--- |
30.2 |
23.2 |
-7.0 |
-23.2% |
Jun |
--- |
--- |
--- |
--- |
--- |
10.6 |
--- |
--- |
30.0 |
22.2 |
-7.9 |
-26.2% |
Jul |
--- |
--- |
--- |
--- |
--- |
12.3 |
--- |
--- |
29.7 |
24.2 |
-5.5 |
-18.6% |
Aug |
--- |
--- |
--- |
--- |
--- |
14.5 |
--- |
--- |
35.6 |
27.4 |
-8.2 |
-23.0% |
Sep |
--- |
--- |
--- |
--- |
--- |
16.3 |
--- |
--- |
41.4 |
29.9 |
-11.5 |
-27.8% |
Oct |
--- |
--- |
--- |
--- |
--- |
14.4 |
--- |
--- |
36.0 |
28.8 |
-7.2 |
-20.1% |
Average |
3.2 |
4.7 |
+45.7% |
+1.5 |
20.5 |
13.2 |
-7.1 |
-41.6% |
33.7 |
26.6 |
-7.0 |
-20.9% |
Wind speed averages and extremes comparison |
||||||
Month |
Total Wind Run La Crosse |
Total Wind Run VP2 |
Total Wind Run Vp2 % Diff from La Crosse |
Highest Wind Gust La Crosse |
Highest Wind Gust VP2 |
Highest Wind Gust VP2 % from La Crosse |
2018 |
|
|
|
|
|
|
Oct |
1383.5 |
1649.6 |
+19% |
59.6 |
49 |
-8.5% |
Nov |
2259.3 |
3521.4 |
+56% |
59.6 |
54 |
-20.8% |
Dec |
2760.2 |
4054.0 |
+47% |
54.4 |
48 |
-19.6% |
2019 |
|
|
|
|
|
|
Jan |
2177.5 |
3613.4 |
+66% |
59.6 |
37 |
-21.5% |
Feb |
3427.9 |
4022.4 |
+17% |
55.7 |
44 |
-20.4% |
Mar |
1817.7 |
3118.3 |
+72% |
48.0 |
46 |
-13.9% |
Apr |
--- |
2666.9 |
--- |
52.9 |
37 |
-24.6% |
May |
--- |
2420.0 |
--- |
73.8 |
52 |
-23.2% |
Jun |
--- |
2153.0 |
--- |
71.3 |
42 |
-26.2% |
Jul |
--- |
2731.7 |
--- |
71.3 |
48 |
-18.6% |
Aug |
--- |
3345.1 |
--- |
78.8 |
56 |
-23.0% |
Sep |
--- |
4110.1 |
--- |
80.3 |
54 |
-27.8% |
Oct |
--- |
3830.4 |
--- |
68.4 |
46 |
-20.1% |
Average |
13826.1 |
41236.3 |
+33.5% |
80.3 |
56 |
-20.9% |